
















Copyright: ©Author(s) 2026.
World J Gastroenterol. Dec 28, 2026; 32(48): 121570
Published online Dec 28, 2026. doi: 10.3748/wjg.121570
Published online Dec 28, 2026. doi: 10.3748/wjg.121570
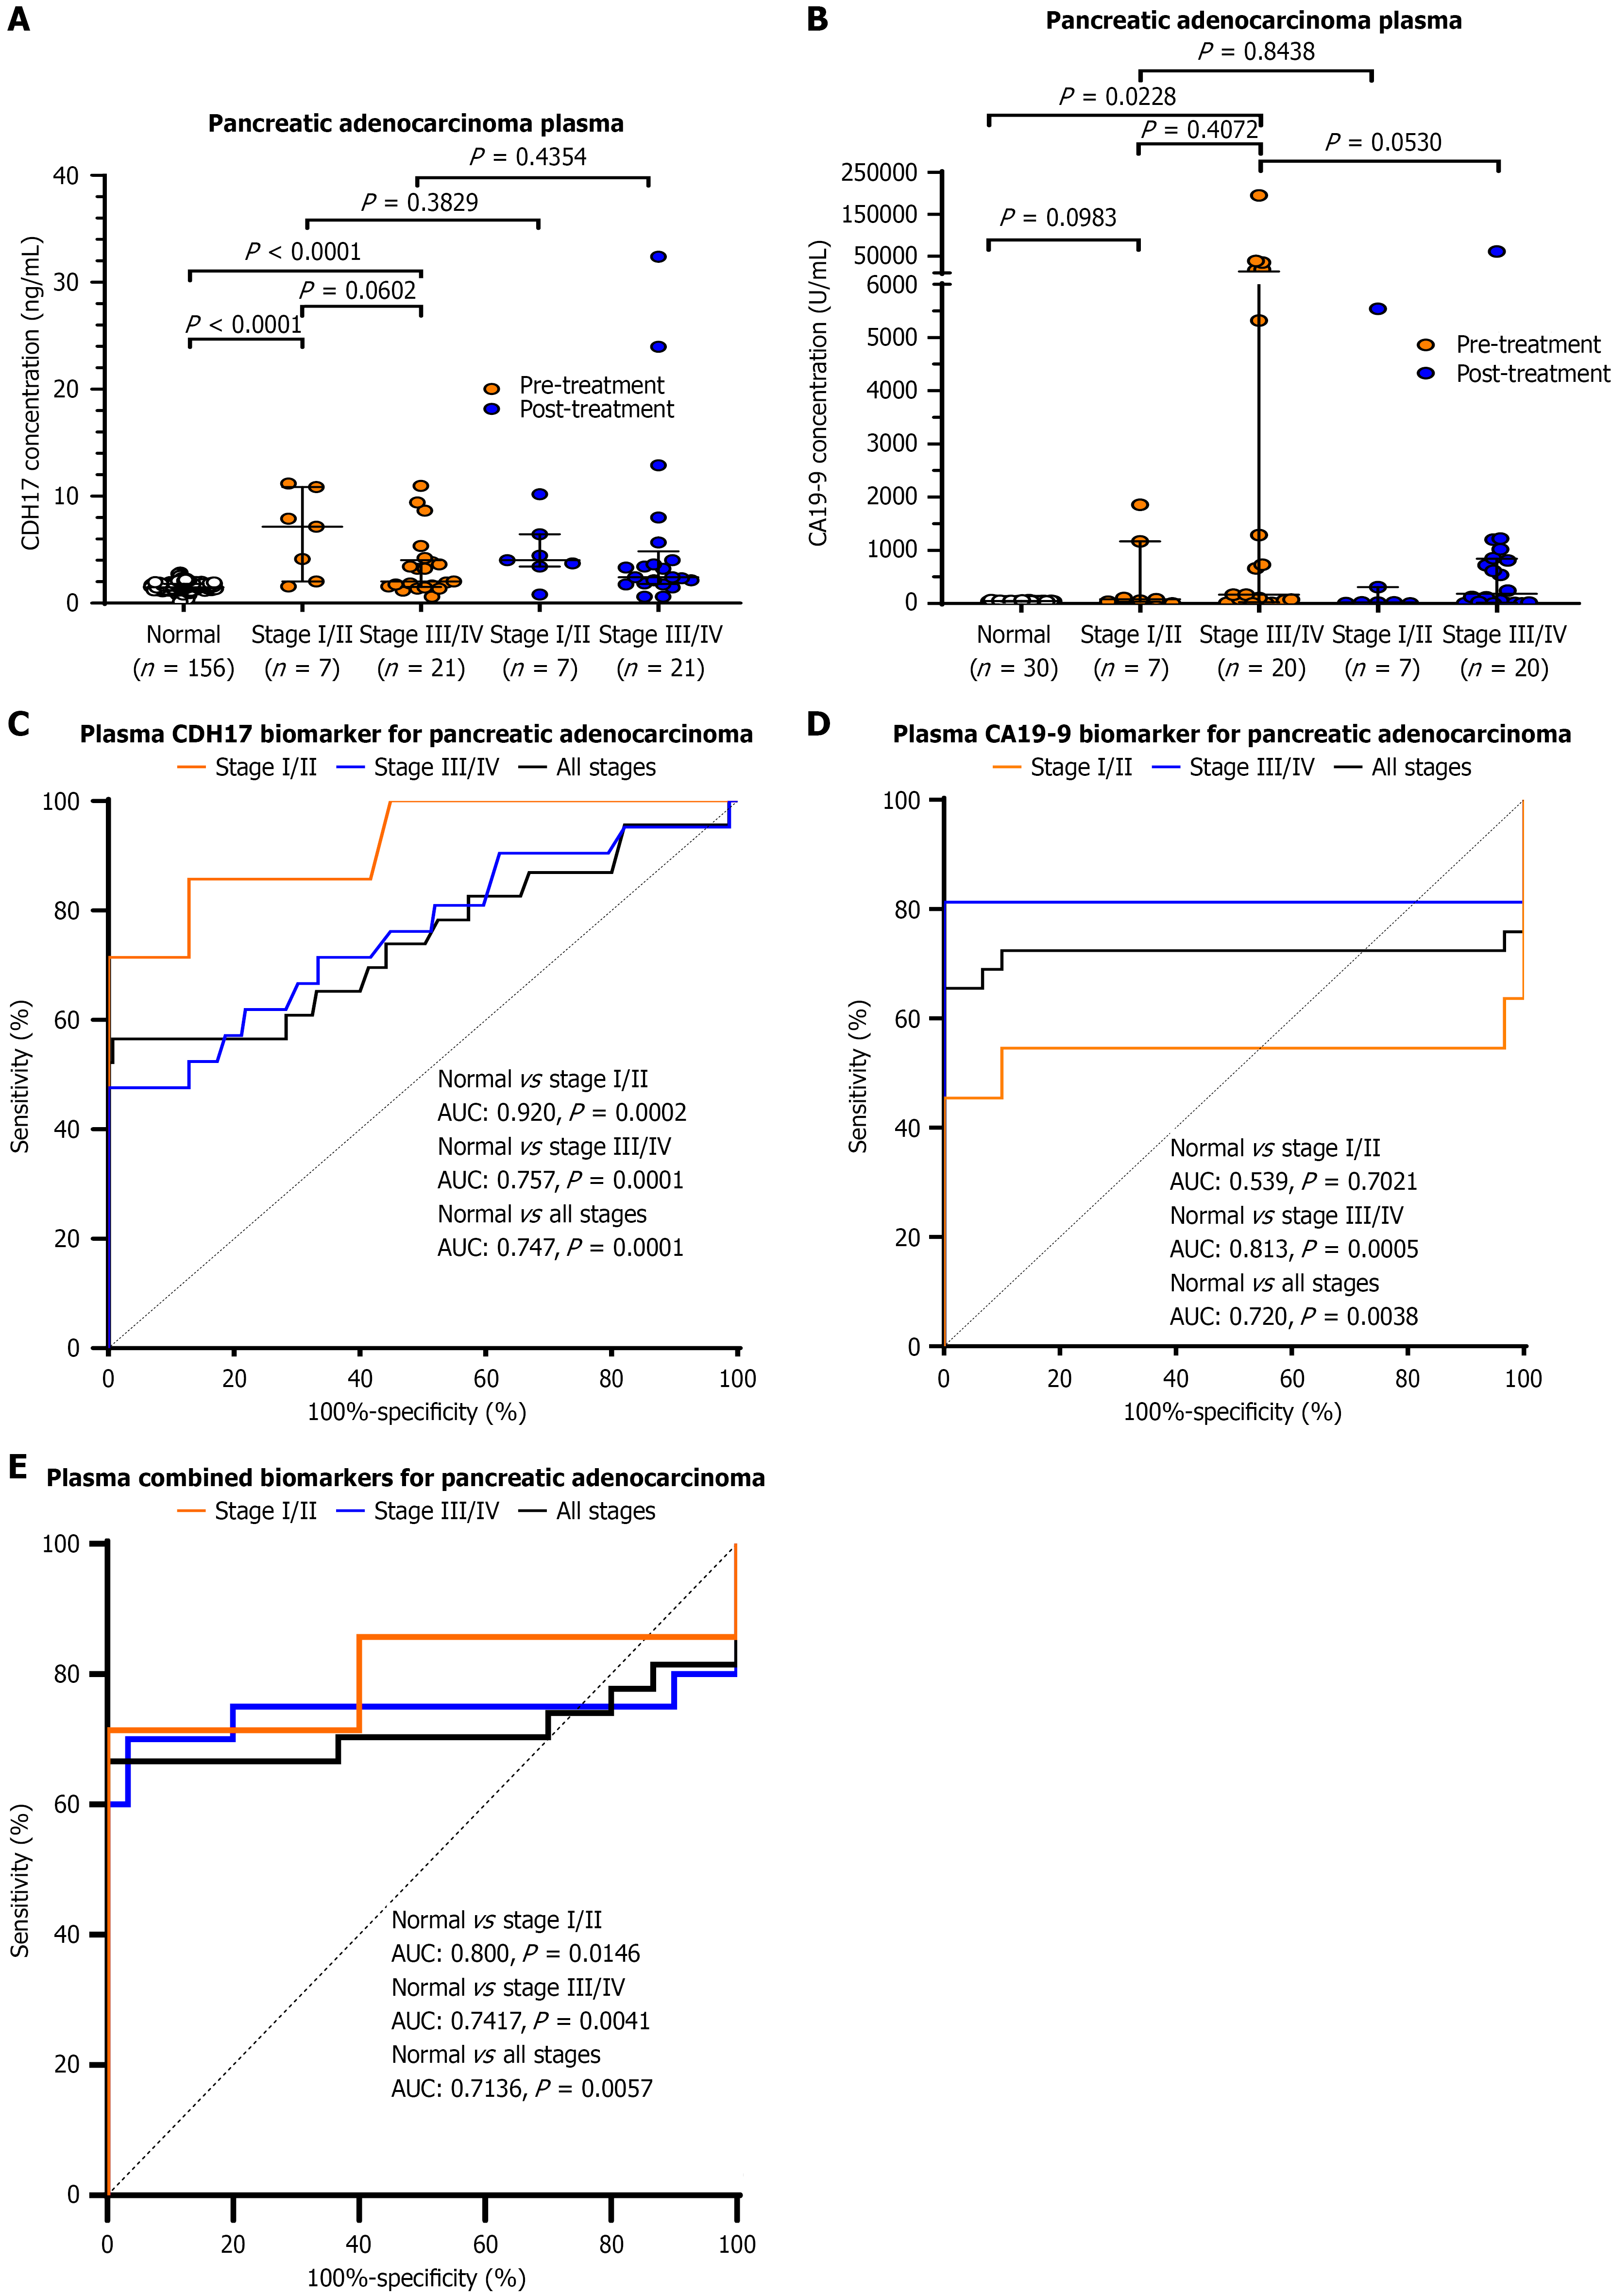
Figure 3 Expression of plasma cadherin 17 and carbohydrate antigen 19-9 in pancreatic adenocarcinoma.
A and B: Plasma cadherin 17 (CDH17) and carbohydrate antigen 19-9 (CA19-9) levels in healthy controls (CDH17: n = 156; CA19-9: n = 30) and patients with stage I/II (n = 7) and stage III/IV (CDH17: n = 21; CA19-9: n = 20) pancreatic adenocarcinoma, measured before and after treatment. Data are presented as median with interquartile range; C and D: Receiver operating characteristic (ROC) curves for CDH17 and CA19-9 in predicting stage I/II, stage III/IV, and all-stage disease based on the area under the curve; E: Combined ROC curve for CDH17 and CA19-9 in early-stage (I/II), late-stage (III/IV) and all stages detection using multiple logistic regression. CDH17: Cadherin 17; CA19-9: Carbohydrate antigen 19-9; AUC: Area under the curve.
- Citation: Cho WC, Yu WS, Hon TC, Cheung ETY, Wang XQ, Wong DA, Wong CSC, Cheuk W, Luk JM. Cadherin-17: A potential biomarker for early detection in pancreatic adenocarcinoma. World J Gastroenterol 2026; 32(48): 121570
- URL: https://www.wjgnet.com/1007-9327/full/v32/i48/121570.htm
- DOI: https://dx.doi.org/10.3748/wjg.121570