
















Copyright: ©Author(s) 2026.
World J Gastroenterol. Dec 28, 2026; 32(48): 121570
Published online Dec 28, 2026. doi: 10.3748/wjg.121570
Published online Dec 28, 2026. doi: 10.3748/wjg.121570
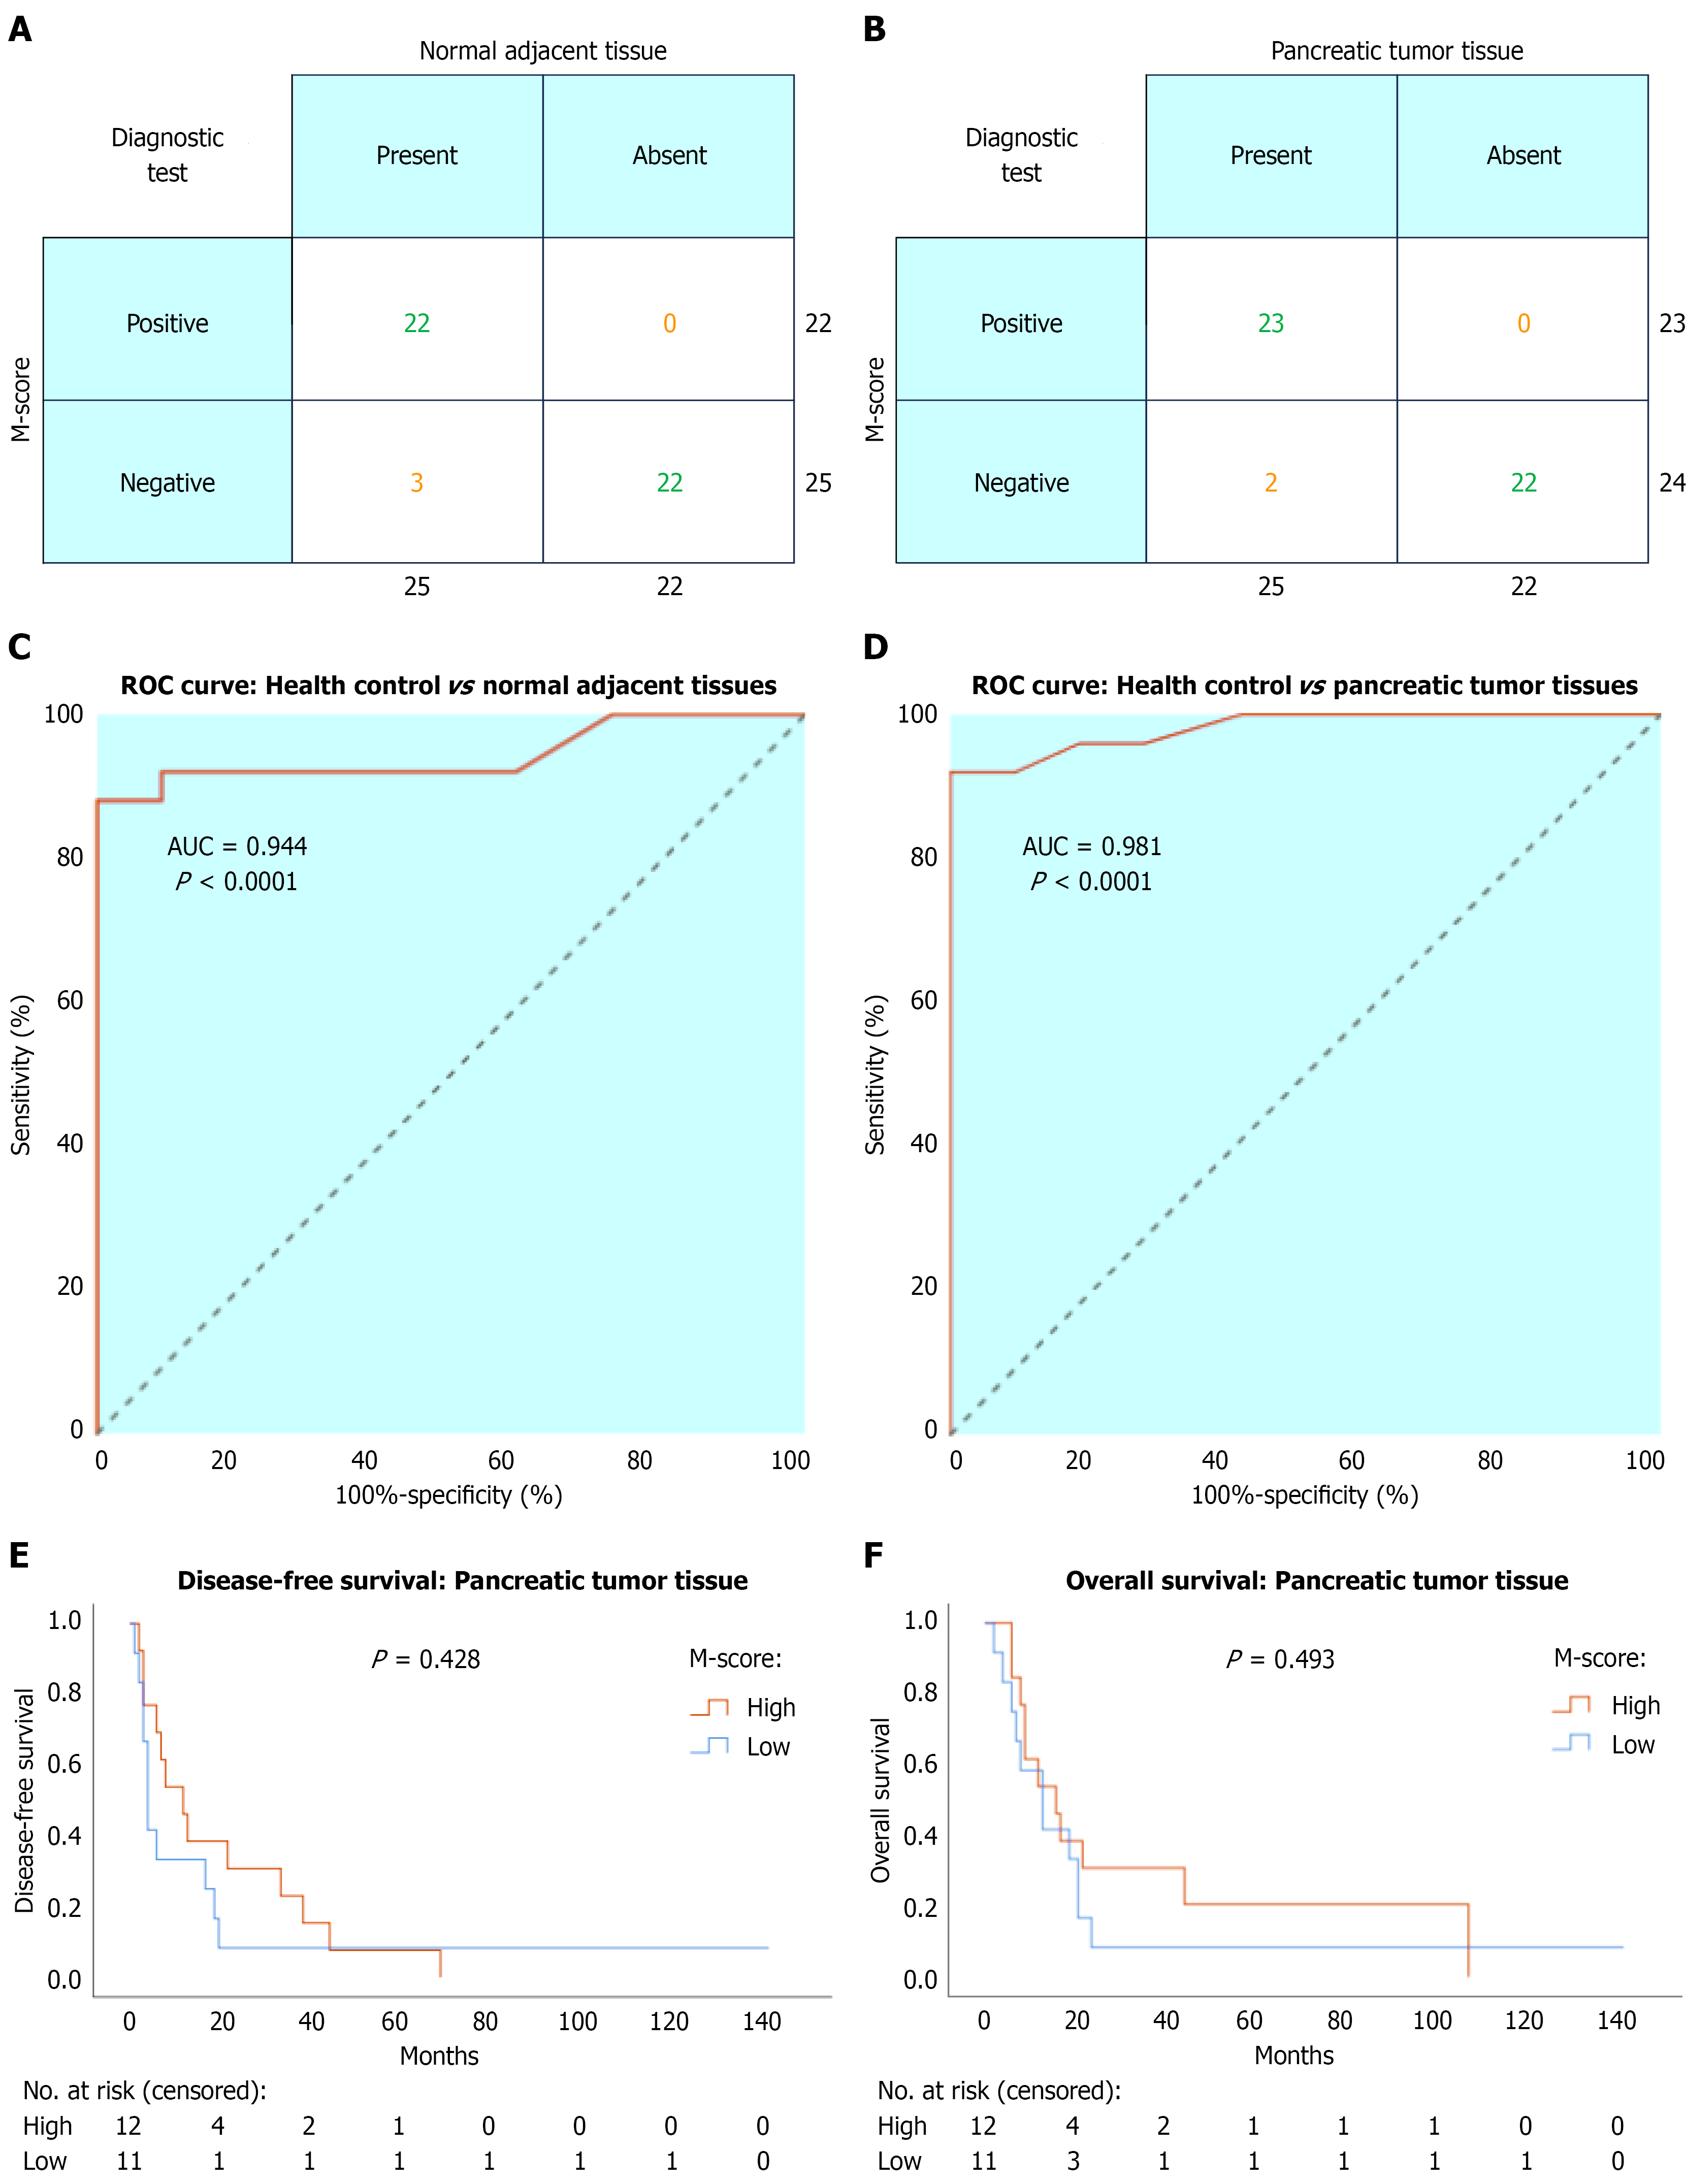
Figure 2 Diagnostic and prognostic performance of the cadherin 17 M-score in pancreatic tissue samples.
A and B: Classification of healthy controls (n = 22), normal adjacent tissues (n = 25), and pancreatic tumor tissues (n = 25) using an M-score cutoff of ≥ 1 to define positivity. For healthy control vs normal adjacent tissues, sensitivity was 88% and specificity 100%. For healthy control vs pancreatic tumor tissues, sensitivity was 92% and specificity 100%; C and D: Receiver operating characteristic curve analysis of the cadherin 17 (CDH17) M-score for detecting normal adjacent tissue and pancreatic tumor tissue. The area under the curve was 0.944 and 0.981, respectively; E and F: Kaplan-Meier survival curves comparing patients with median-high vs median-low CDH17 M-scores for disease-free survival and overall survival. No significant differences were observed for either endpoint (log-rank test). ROC: Receiver operating characteristic; AUC: Area under the curve.
- Citation: Cho WC, Yu WS, Hon TC, Cheung ETY, Wang XQ, Wong DA, Wong CSC, Cheuk W, Luk JM. Cadherin-17: A potential biomarker for early detection in pancreatic adenocarcinoma. World J Gastroenterol 2026; 32(48): 121570
- URL: https://www.wjgnet.com/1007-9327/full/v32/i48/121570.htm
- DOI: https://dx.doi.org/10.3748/wjg.121570