
















Copyright: ©Author(s) 2026.
World J Gastroenterol. Dec 21, 2026; 32(47): 124207
Published online Dec 21, 2026. doi: 10.3748/wjg.124207
Published online Dec 21, 2026. doi: 10.3748/wjg.124207
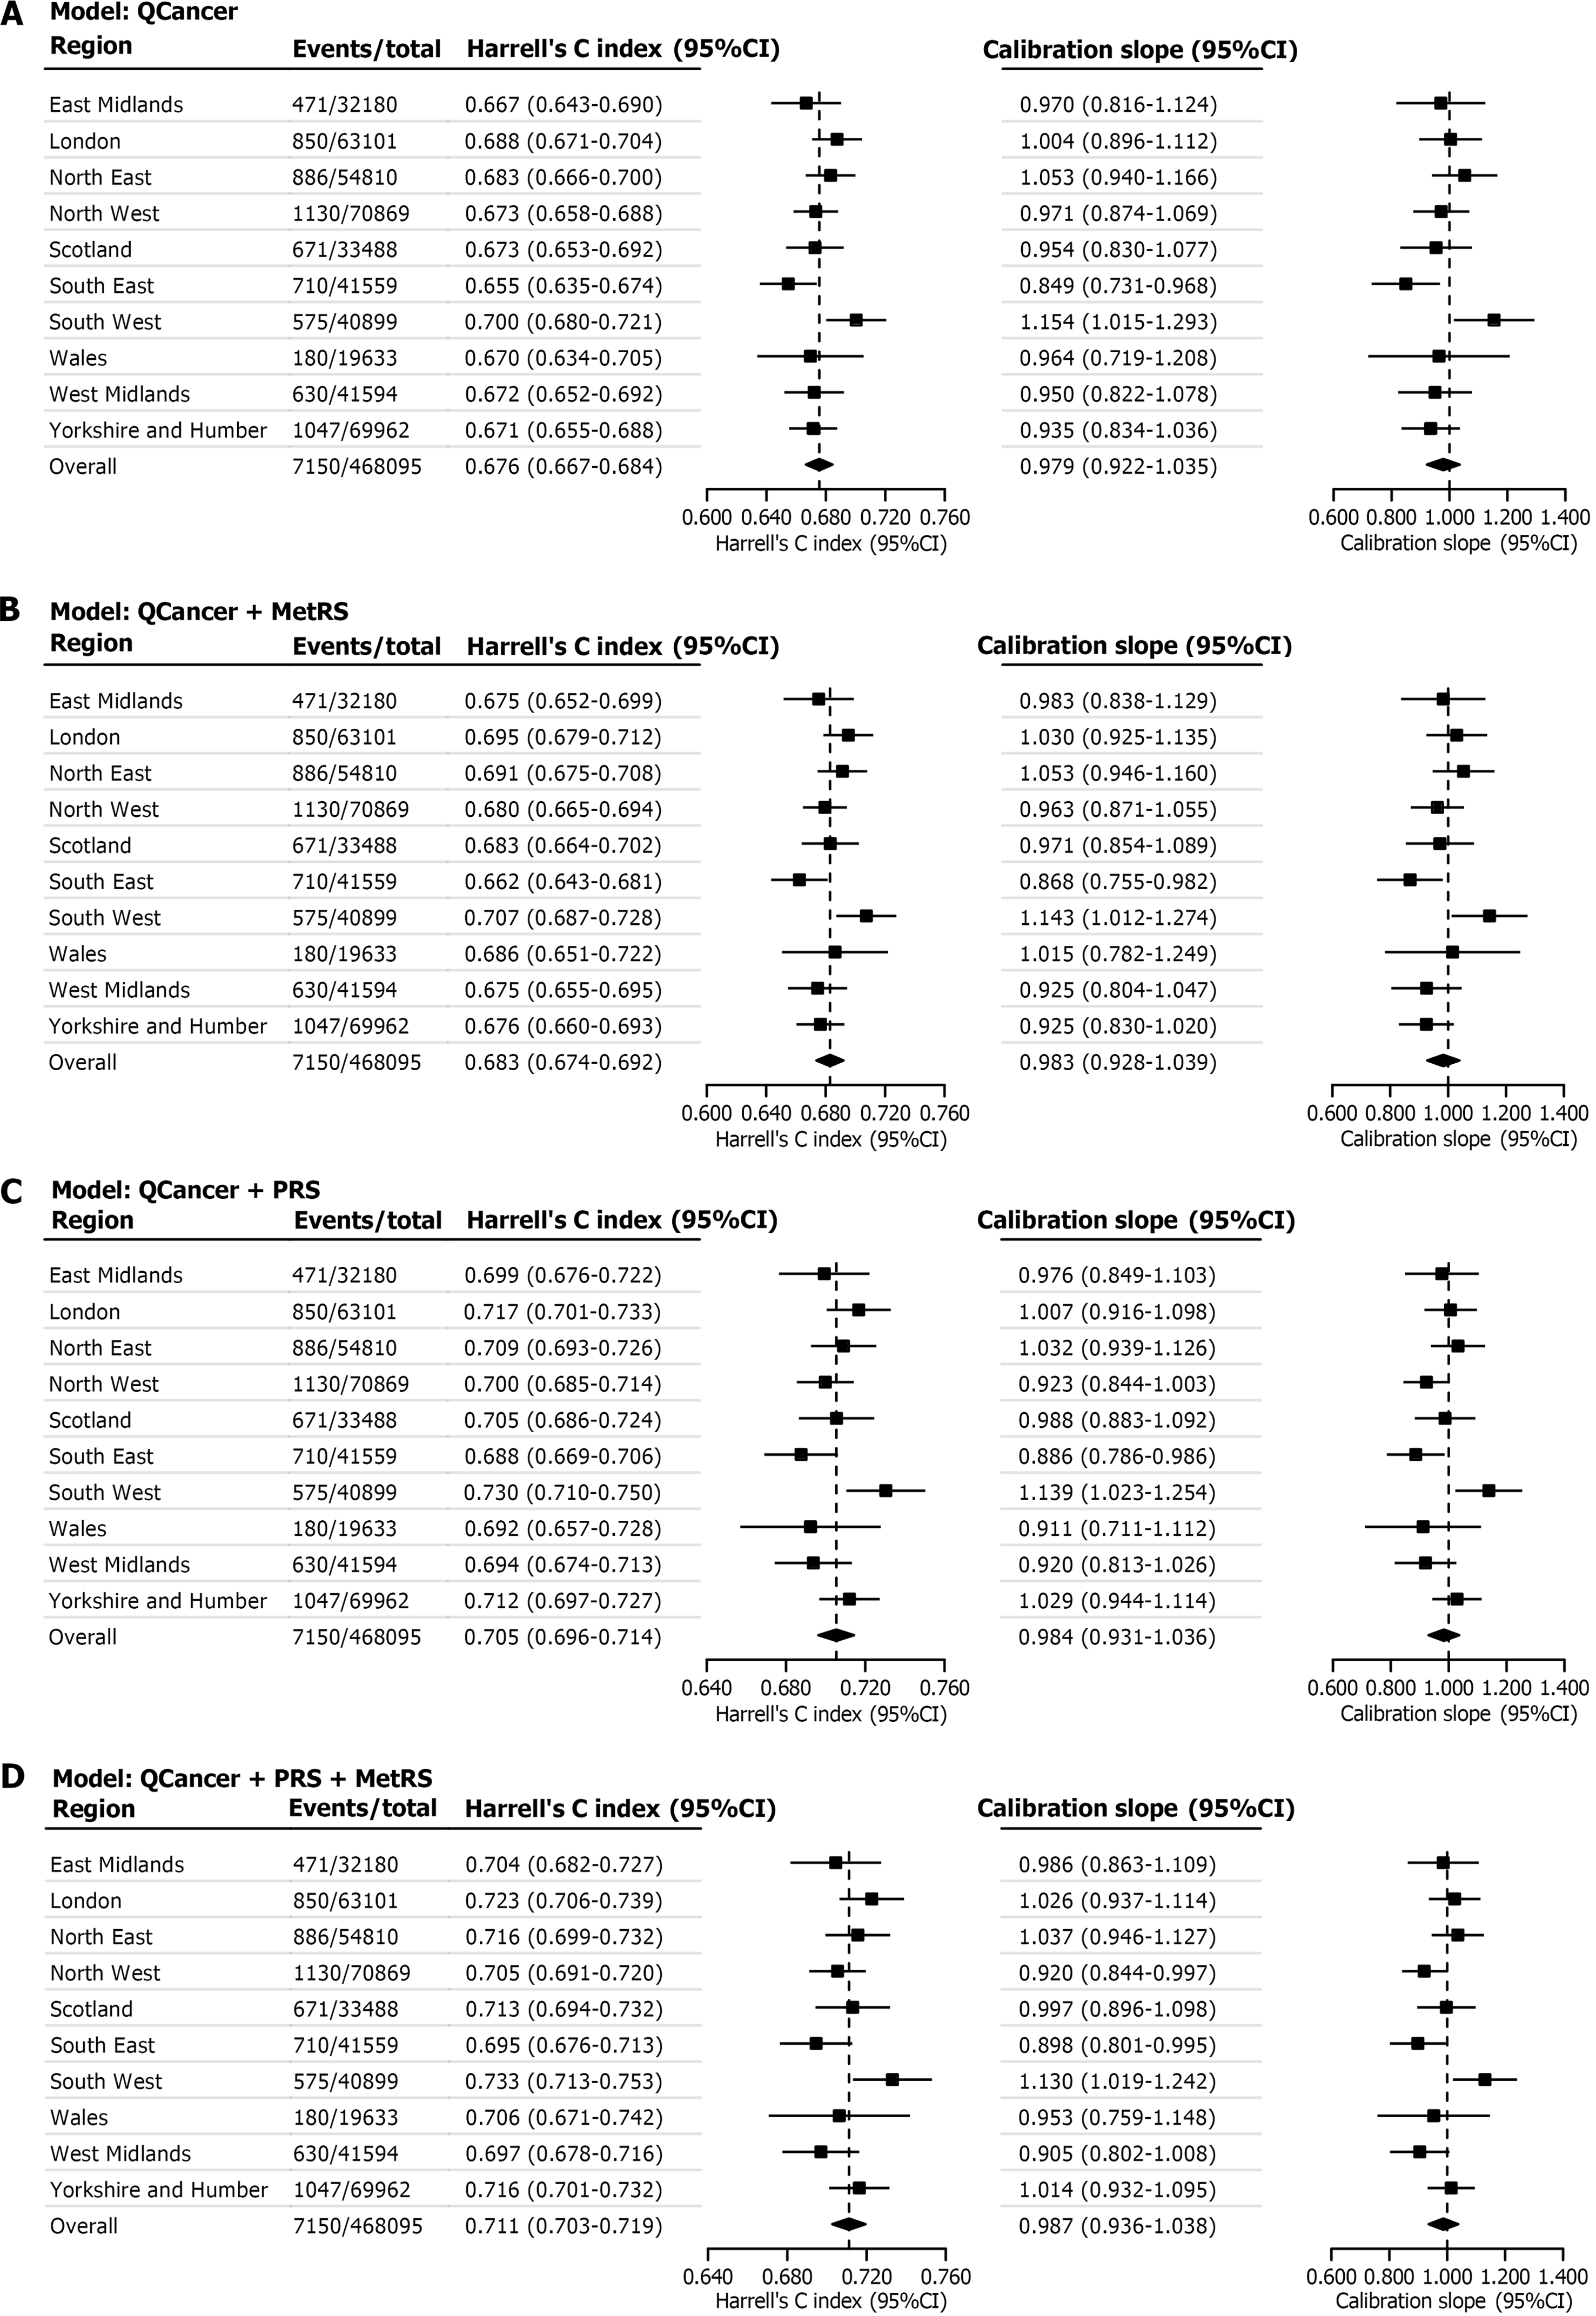
Figure 3 Regional and pooled estimates of Harrell’s C-index and calibration slope for the four colorectal cancer prediction models.
Region-specific estimates were pooled using random-effects meta-analysis. The calibration slope was calculated using the Cox model linear predictor. QCancer denotes the adapted QCancer model used in this study. CI: Confidence interval; MetRS: Metabolomic risk score; PRS: Polygenic risk score.
- Citation: Zeng LT, Hu JN, Pang MH, Cao QX, Hou NY, Liu F. Integrating metabolomics, clinical factors, and genetic risk for colorectal cancer risk prediction: Model development and internal-external cross-validation. World J Gastroenterol 2026; 32(47): 124207
- URL: https://www.wjgnet.com/1007-9327/full/v32/i47/124207.htm
- DOI: https://dx.doi.org/10.3748/wjg.124207