
















Copyright: ©Author(s) 2026.
World J Gastroenterol. Dec 21, 2026; 32(47): 124207
Published online Dec 21, 2026. doi: 10.3748/wjg.124207
Published online Dec 21, 2026. doi: 10.3748/wjg.124207
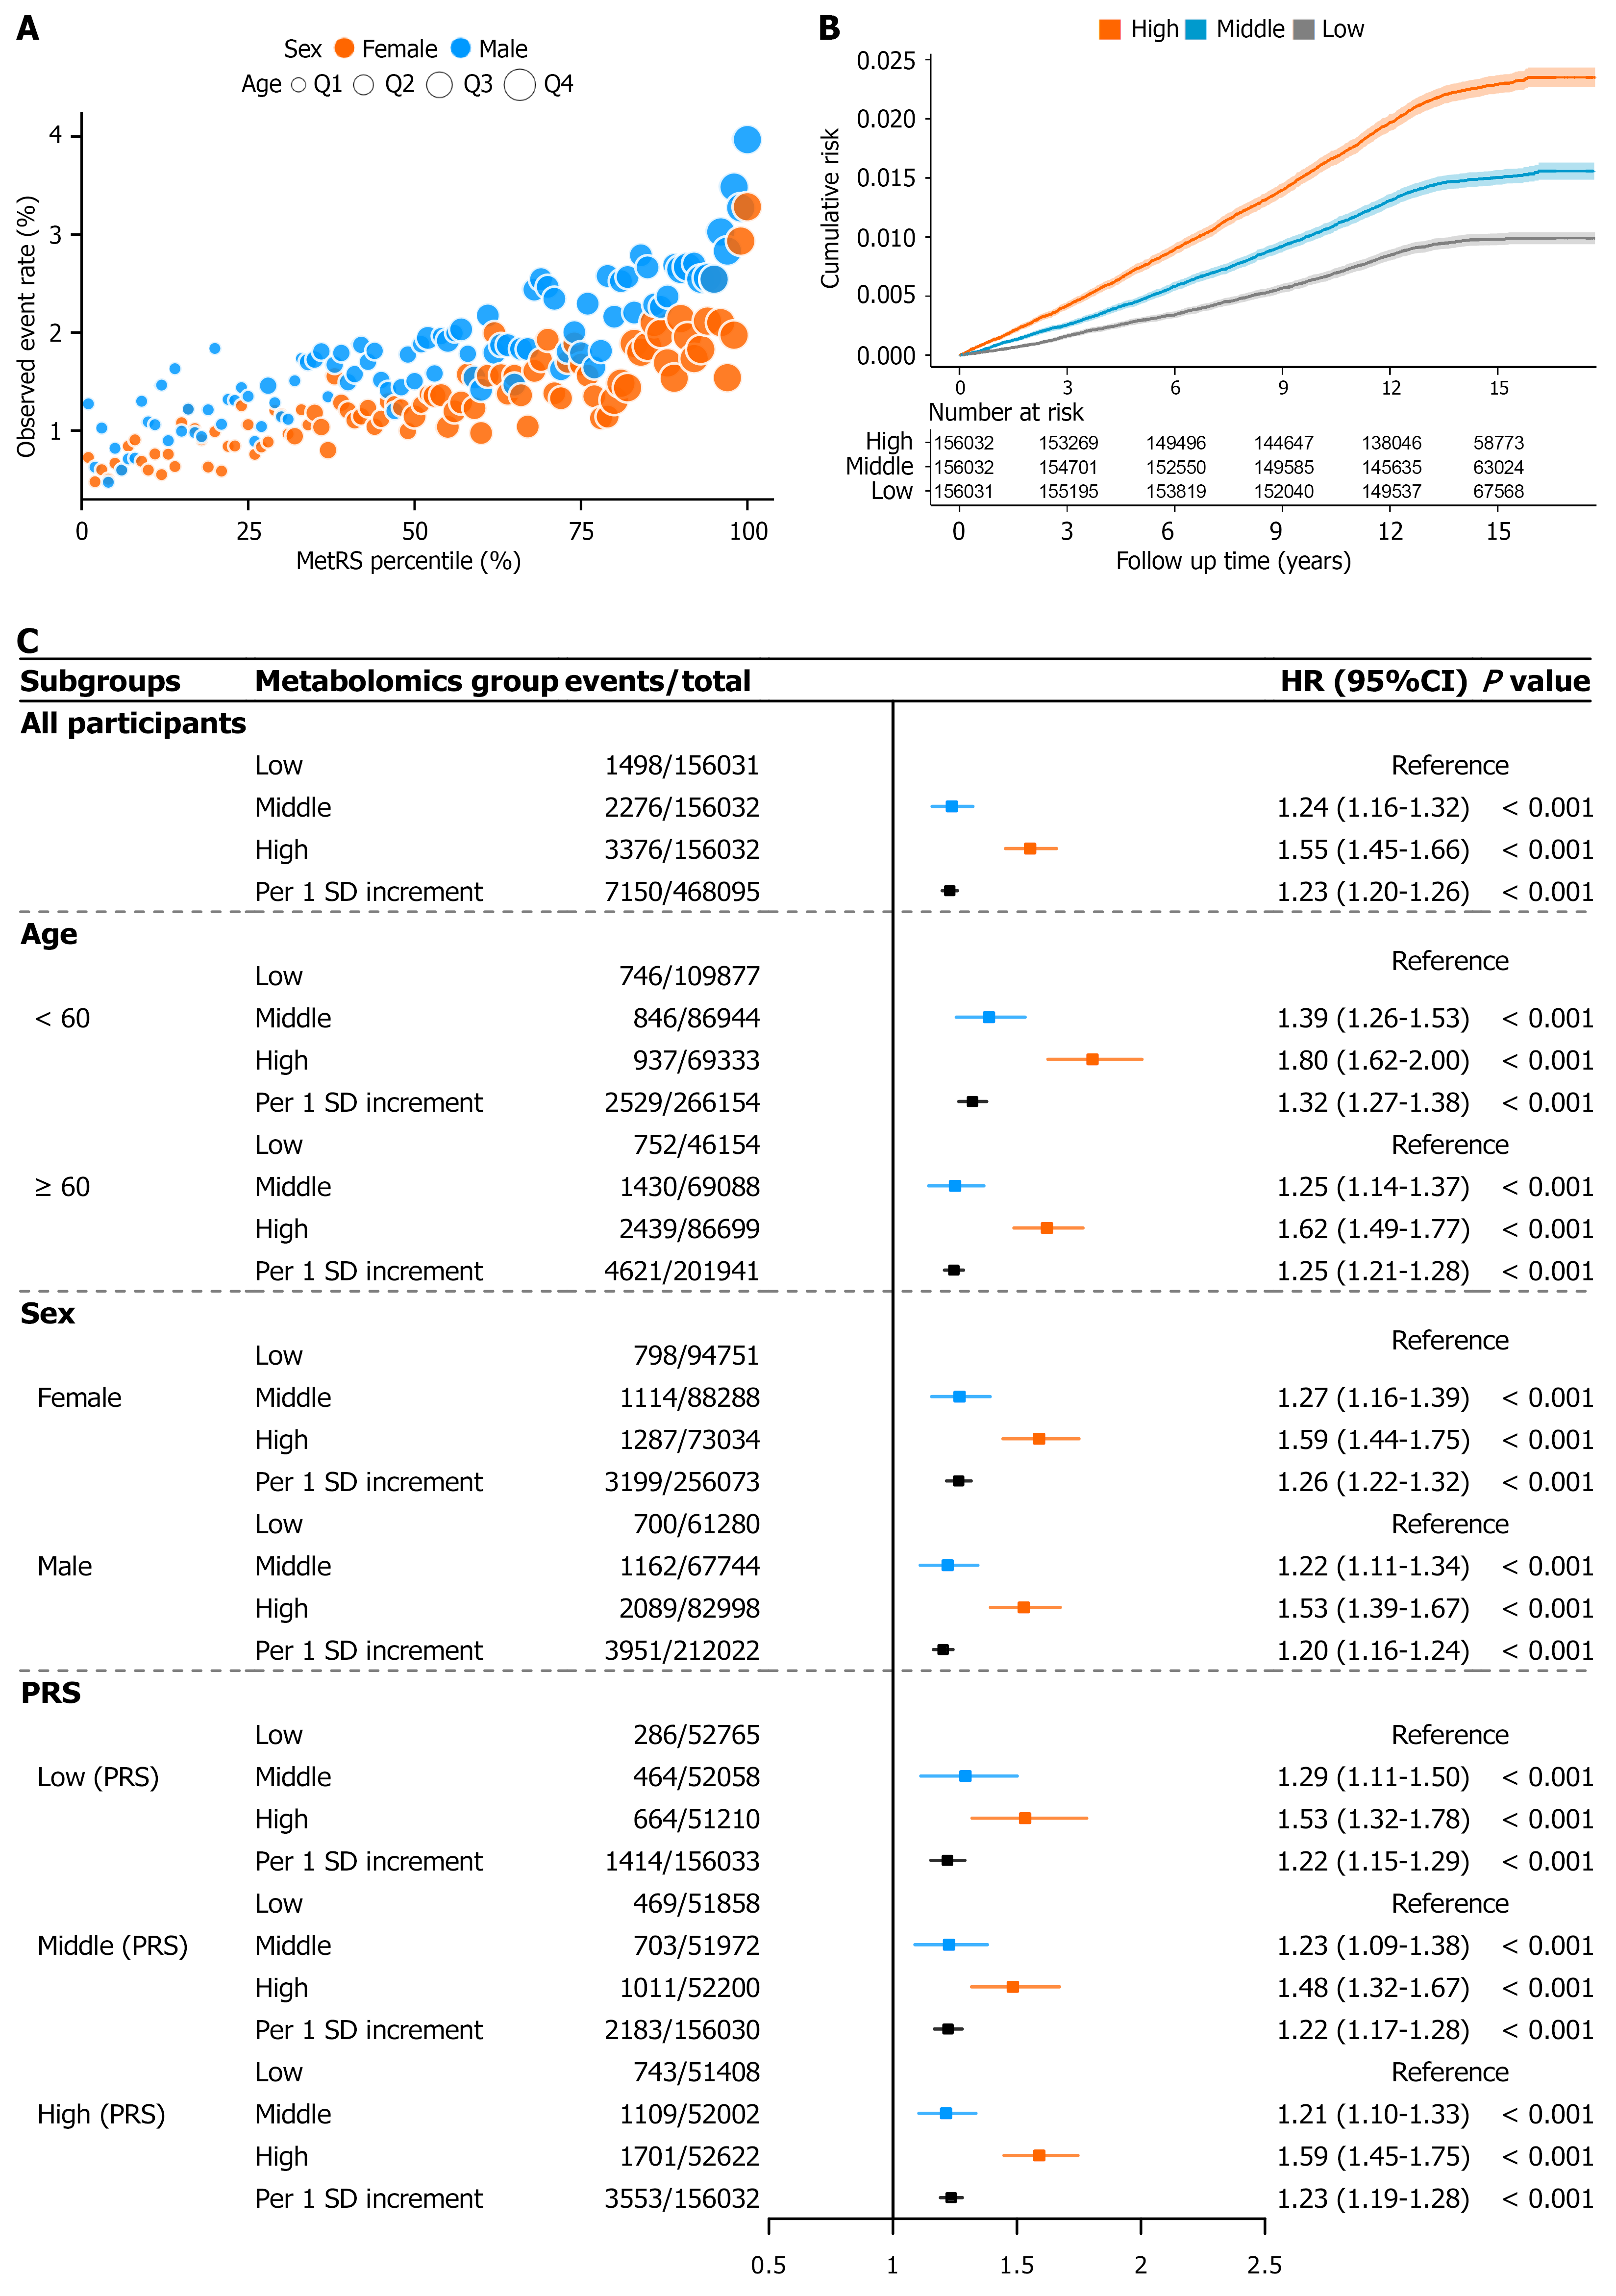
Figure 2 Risk stratification of incident colorectal cancer by metabolomic risk score.
A: Observed colorectal cancer (CRC) event rates across metabolomic risk score (MetRS) percentiles in the overall population. Blue points indicate men and orange points indicate women; point size represents age quartiles (Q1-Q4); B: Cumulative CRC risk during follow-up across the low, middle, and high MetRS tertiles; C: Hazard ratios for the association between MetRS and incident CRC in the overall population and in subgroups defined by age, sex, and polygenic risk score tertiles. CI: Confidence interval; CRC: Colorectal cancer; HR: Hazard ratio; MetRS: Metabolomic risk score; PRS: Polygenic risk score; SD: Standard deviation.
- Citation: Zeng LT, Hu JN, Pang MH, Cao QX, Hou NY, Liu F. Integrating metabolomics, clinical factors, and genetic risk for colorectal cancer risk prediction: Model development and internal-external cross-validation. World J Gastroenterol 2026; 32(47): 124207
- URL: https://www.wjgnet.com/1007-9327/full/v32/i47/124207.htm
- DOI: https://dx.doi.org/10.3748/wjg.124207