
















Copyright: ©Author(s) 2026.
World J Gastroenterol. Dec 21, 2026; 32(47): 123905
Published online Dec 21, 2026. doi: 10.3748/wjg.123905
Published online Dec 21, 2026. doi: 10.3748/wjg.123905
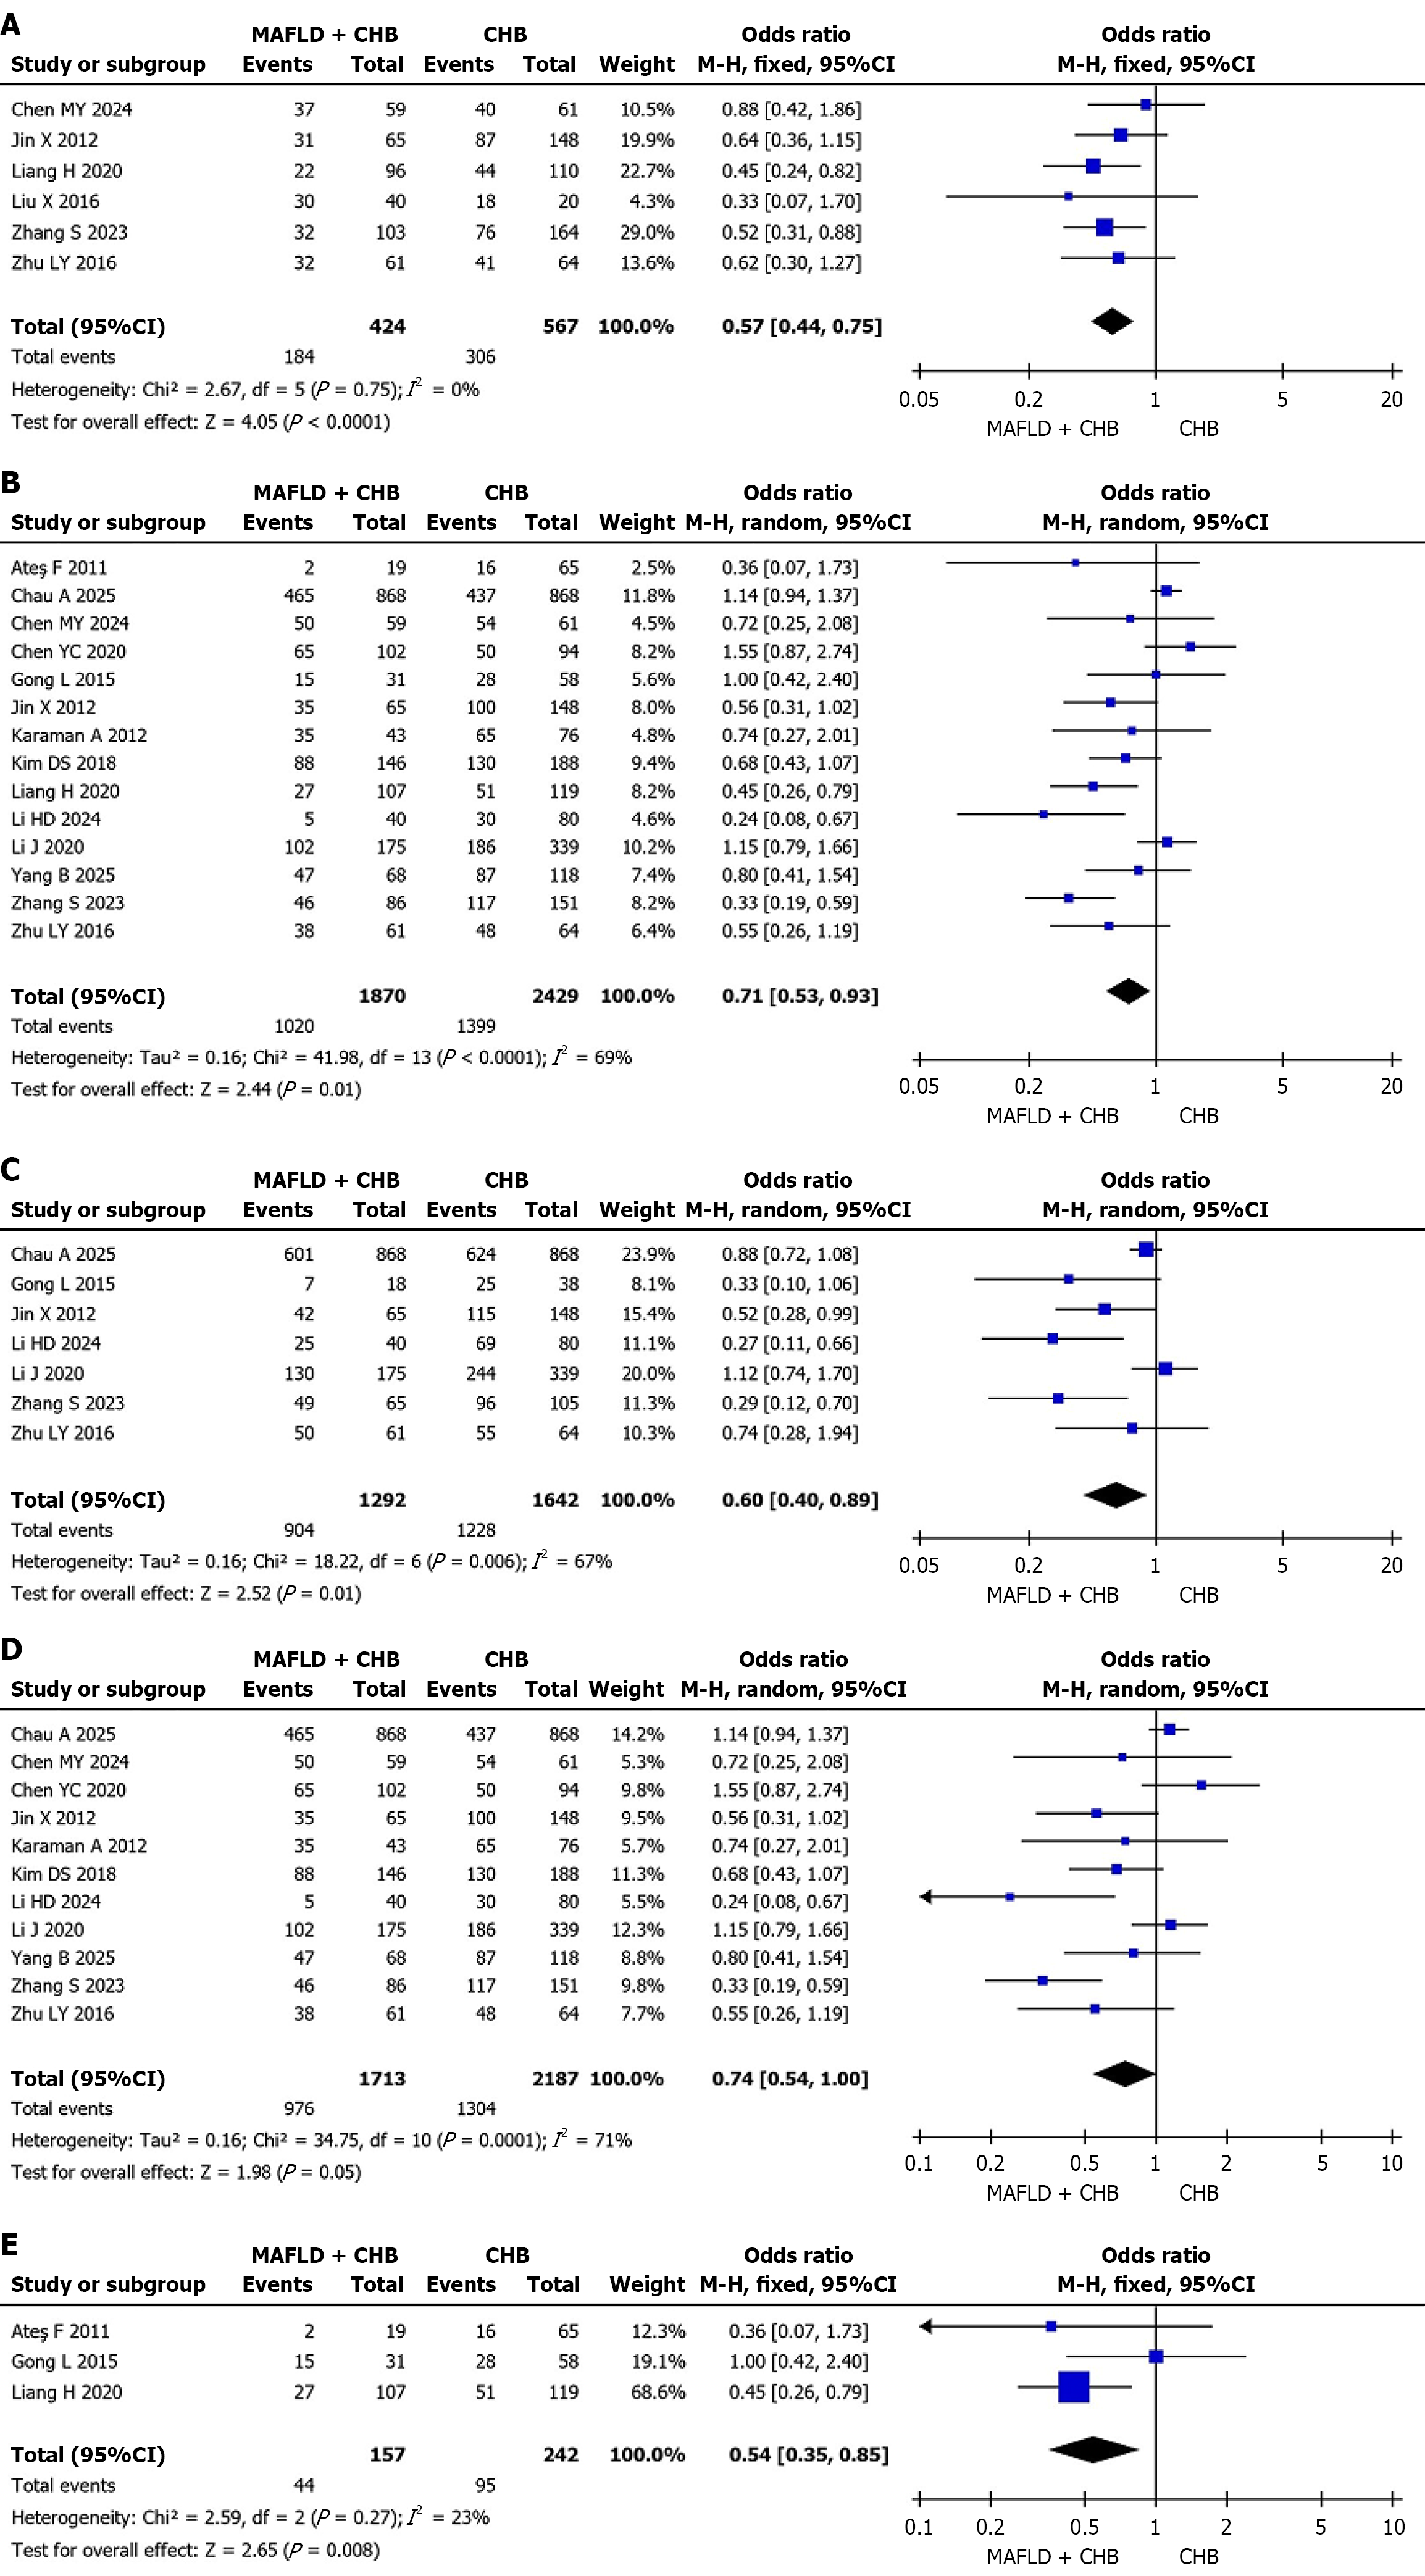
Figure 5 Forest plots comparing hepatitis B virus DNA clearance rates between patients with chronic hepatitis B alone and those with chronic hepatitis B and metabolic dysfunction-associated fatty liver disease.
A: 24 weeks; B: 48 weeks; C: 96 weeks; D: 48 weeks nucleos(t)ide analogues therapy; E: 48 weeks, interferon-based therapy. Pooled effects are expressed as odds ratios with 95%CIs. MAFLD: Metabolic dysfunction-associated fatty liver disease; CHB: Chronic hepatitis B.
- Citation: Liu J, Zhang P, Hu KZ, Zhao ZH, Xin YN, Bi YZ. Metabolic dysfunction-associated fatty liver and antiviral response in chronic hepatitis B: A systematic review and meta-analysis. World J Gastroenterol 2026; 32(47): 123905
- URL: https://www.wjgnet.com/1007-9327/full/v32/i47/123905.htm
- DOI: https://dx.doi.org/10.3748/wjg.123905