
















Copyright: ©Author(s) 2026.
World J Gastroenterol. Dec 21, 2026; 32(47): 122668
Published online Dec 21, 2026. doi: 10.3748/wjg.122668
Published online Dec 21, 2026. doi: 10.3748/wjg.122668
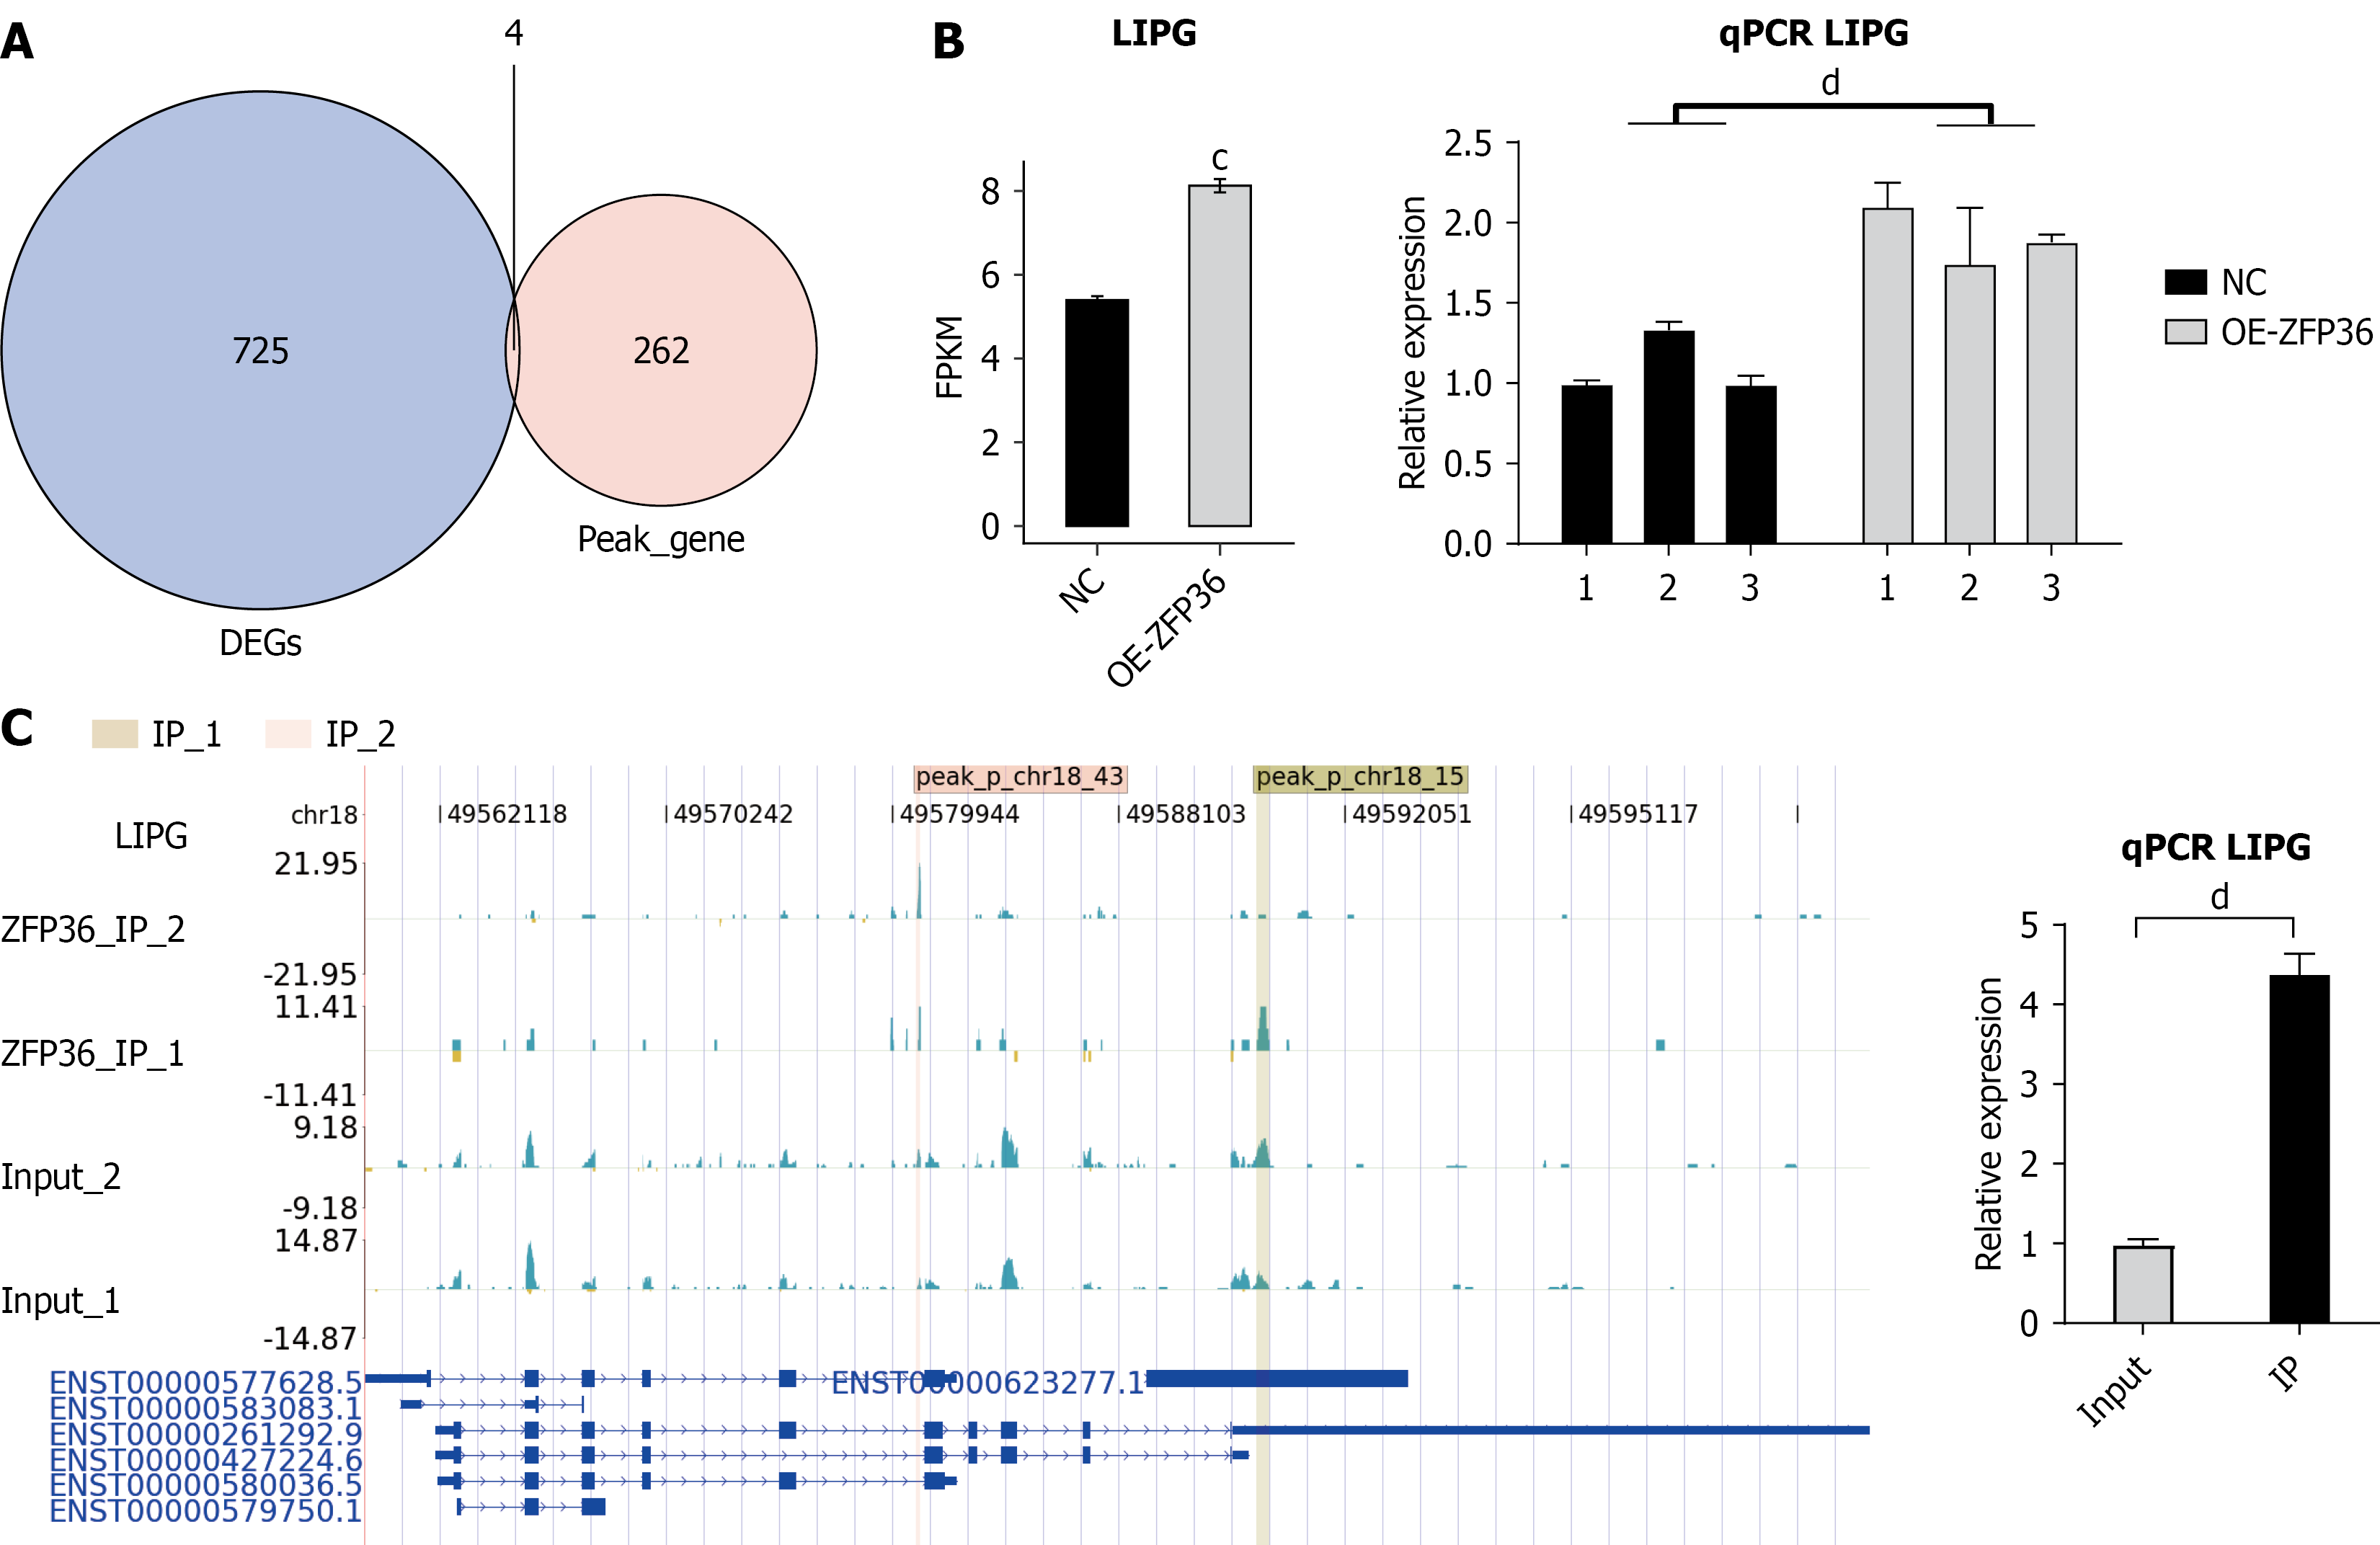
Figure 5 Integrative analysis of ZFP36-bound RNAs and differentially expressed genes.
A: Venn diagram illustrating overlap between ZFP36 peak-associated genes and differentially expressed genes; B: Lipase G (LIPG) expression patterns and statistical differences derived from RNA sequencing and reverse transcription-quantitative polymerase chain reaction validation are shown via bar plot; C: ZFP36 binding peaks within the LIPG gene. Left panel: Read density distribution of ZFP36-binding peaks across LIPG. Right panel: RNA immunoprecipitation-quantitative polymerase chain reaction quantification of LIPG expression based on improved RNA immunoprecipitation sequencing data. cP < 0.001, dP < 0.0001. DEG: Differentially expressed gene; LIPG: Lipase G; FPKM: Fragments per kilobase of transcript per million mapped reads; NC: Negative control; OE: Overexpression; qPCR: Quantitative polymerase chain reaction.
- Citation: Yu PJ, Zhu SM, Cai BJ, Ma XM, Qiao WJ, Han JJ, Zhang CW. Zfp36 zinc finger CCCH-type inhibits gastric cancer progression by upregulating lipase G and binding its 3’ untranslated region. World J Gastroenterol 2026; 32(47): 122668
- URL: https://www.wjgnet.com/1007-9327/full/v32/i47/122668.htm
- DOI: https://dx.doi.org/10.3748/wjg.122668