
















Copyright: ©Author(s) 2026.
World J Gastroenterol. Dec 21, 2026; 32(47): 121762
Published online Dec 21, 2026. doi: 10.3748/wjg.121762
Published online Dec 21, 2026. doi: 10.3748/wjg.121762
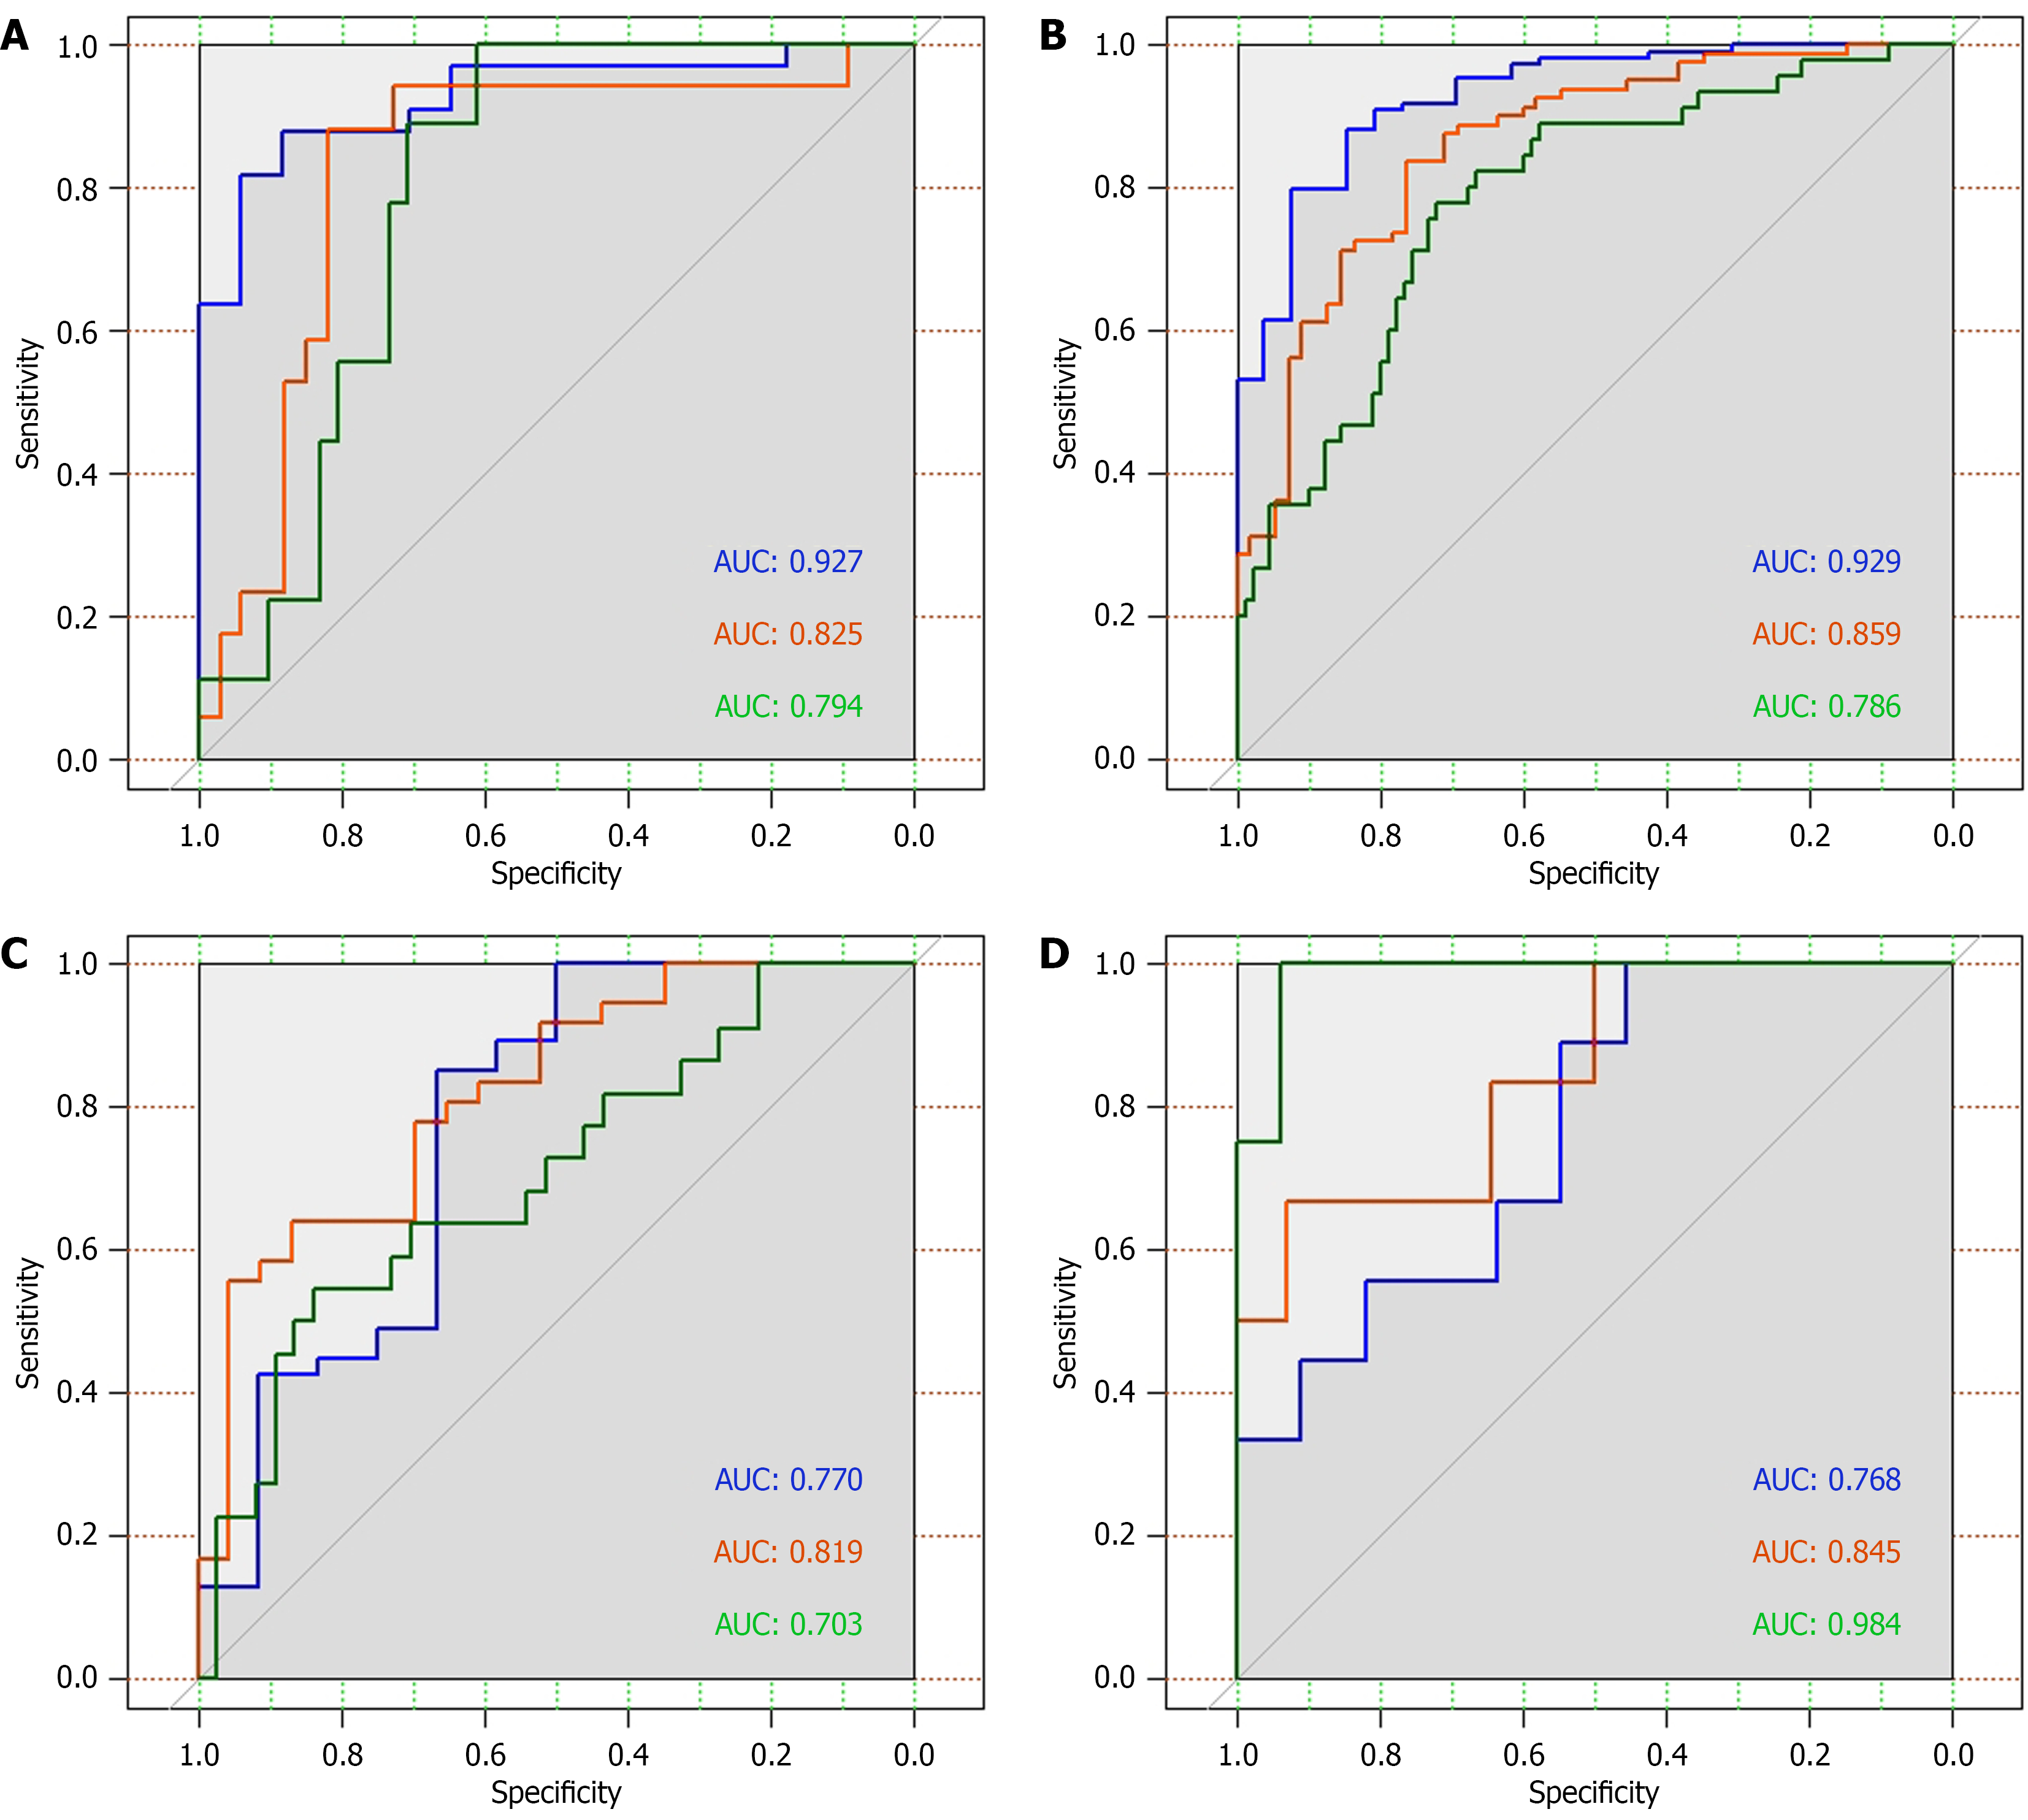
Figure 4 The area under the curve values from the receiver operating characteristic analyses in different tumor subtypes.
A: Intrahepatic cholangiocarcinoma; B: Perihilar cholangiocarcinoma; C: Distal cholangiocarcinoma; D: Gallbladder carcinoma. The blue curve predicted the 3-month overall survival (OS), the orange curve predicted the 6-month OS, and the green curve predicted the 1-year OS. AUC: Area under the curve.
- Citation: Zhang YZ, Tang YZ, Pan ST, He YX, Dai HC, Zhou WZ, Zhou HF. Survival prediction for patients with malignant biliary obstruction caused by biliary tract cancer undergoing percutaneous biliary decompression. World J Gastroenterol 2026; 32(47): 121762
- URL: https://www.wjgnet.com/1007-9327/full/v32/i47/121762.htm
- DOI: https://dx.doi.org/10.3748/wjg.121762