
















Copyright: ©Author(s) 2026.
World J Gastroenterol. Dec 21, 2026; 32(47): 121435
Published online Dec 21, 2026. doi: 10.3748/wjg.121435
Published online Dec 21, 2026. doi: 10.3748/wjg.121435
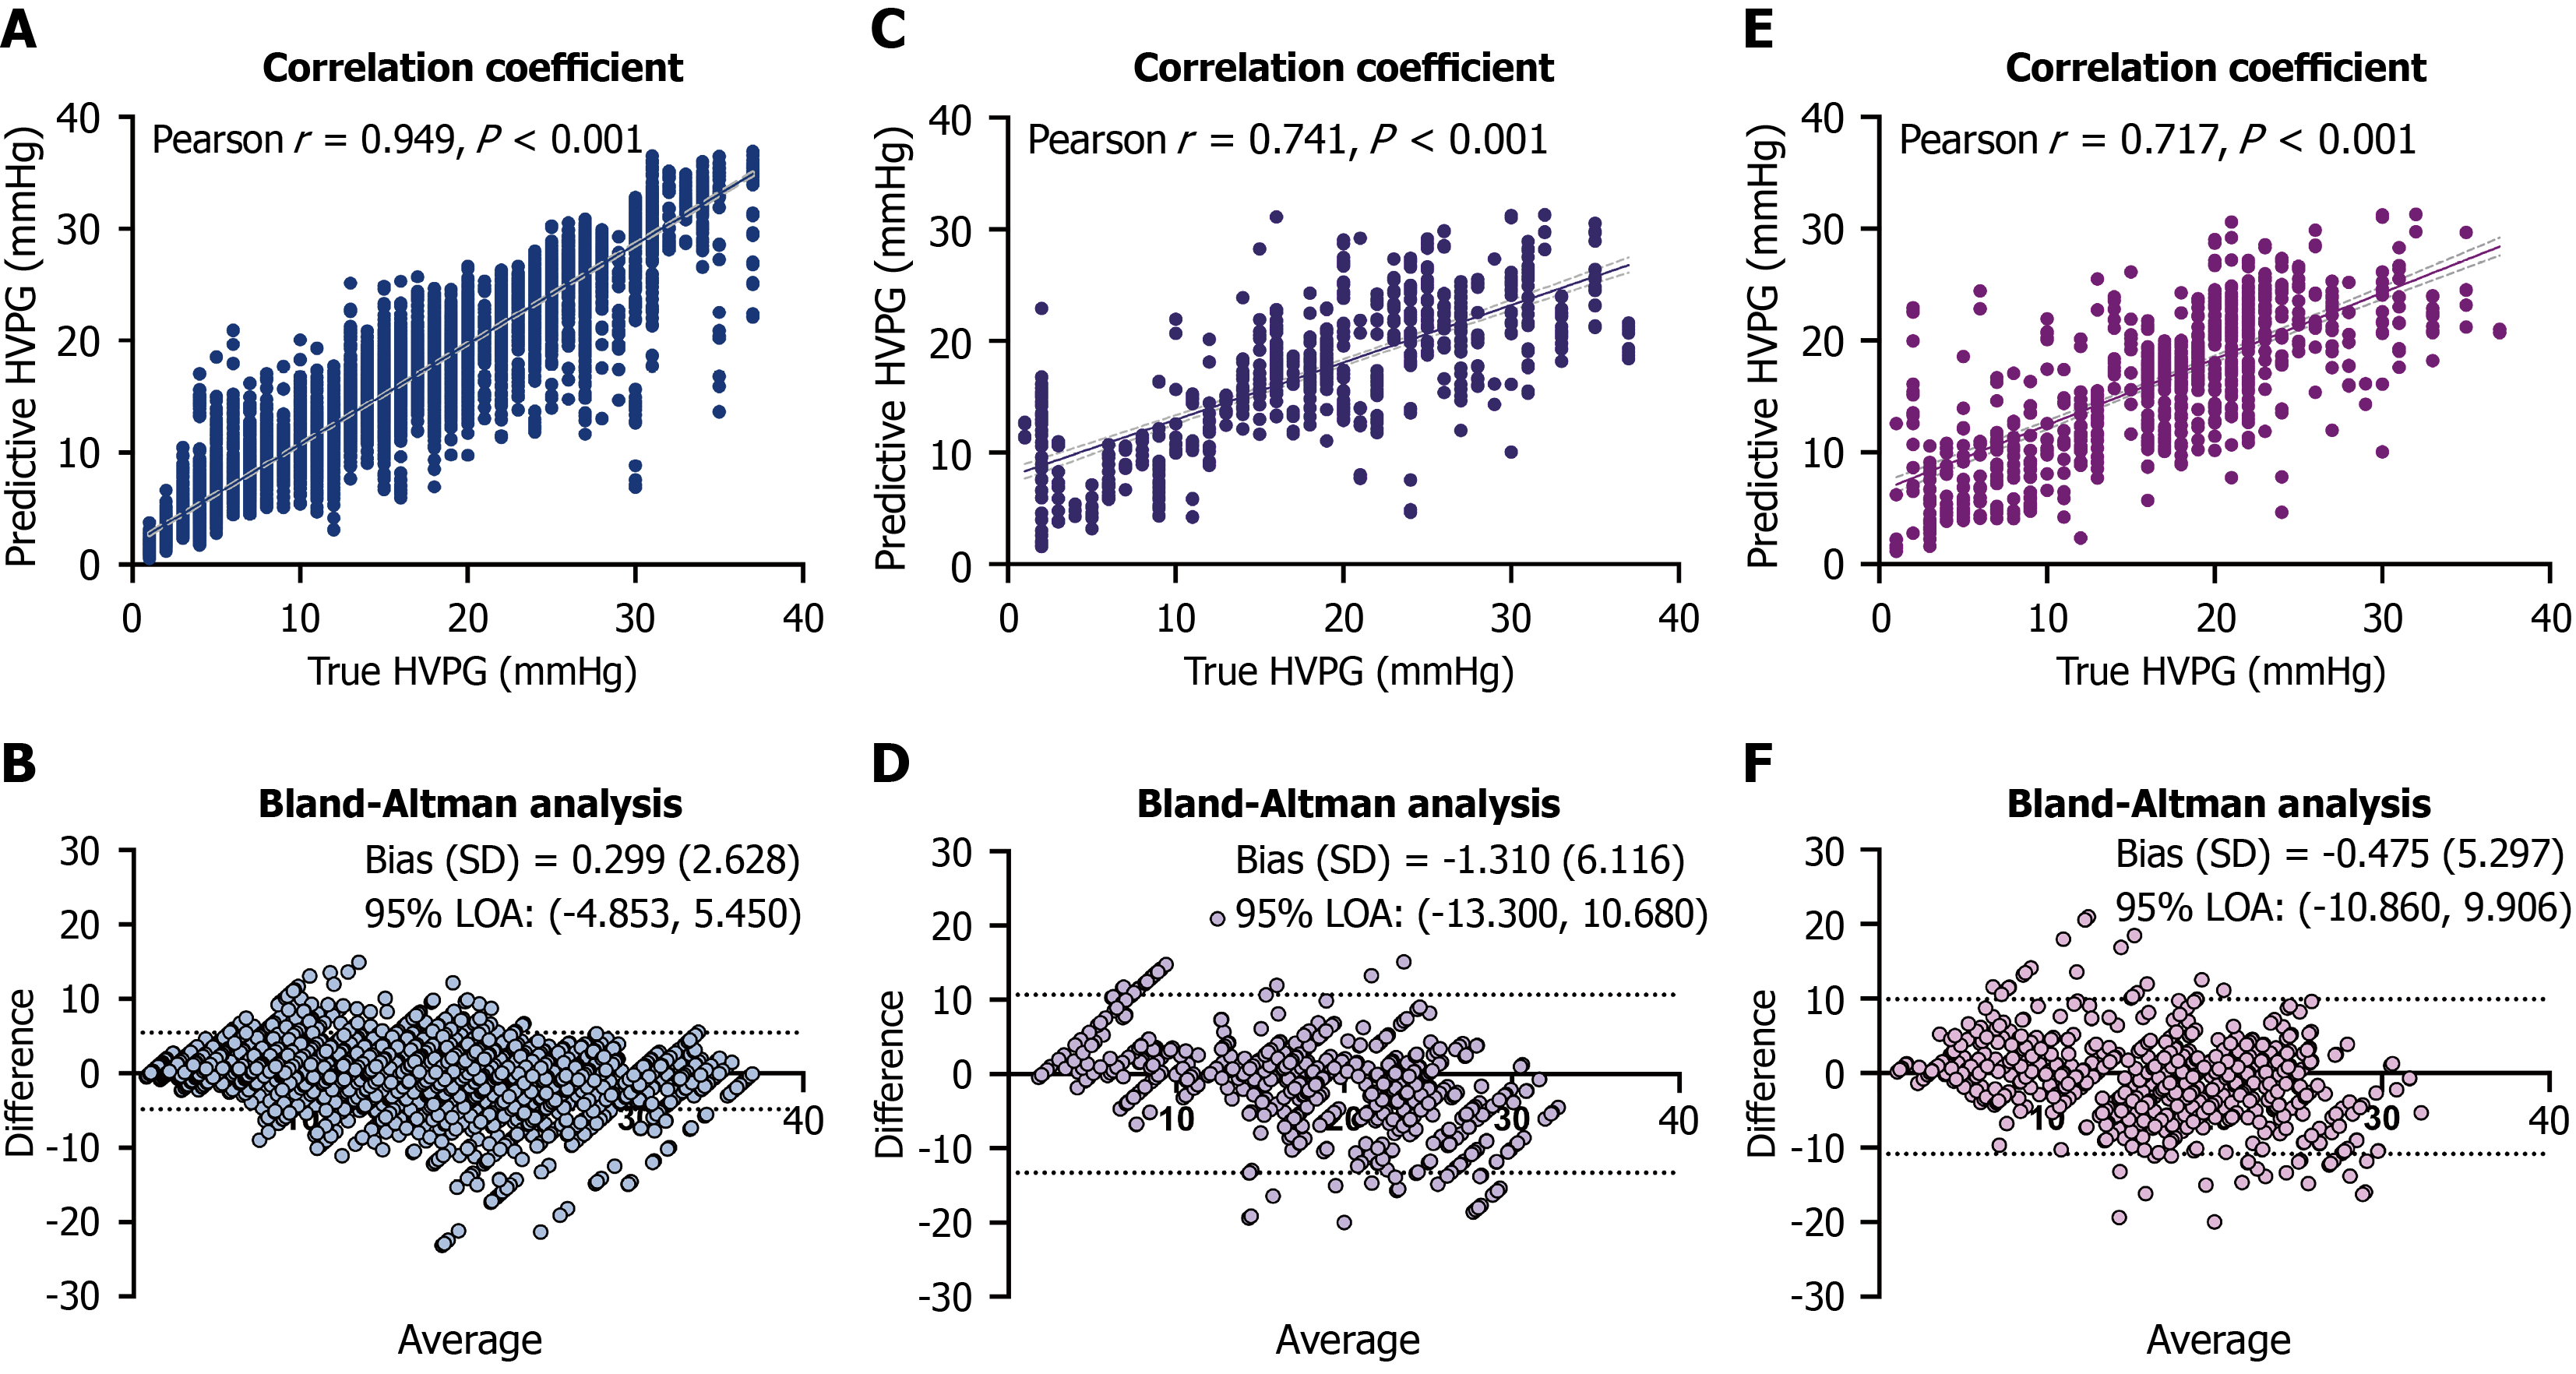
Figure 3 Correlation and agreement between the predictive and actual hepatic venous pressure gradient values.
Scatterplot and Bland-Altman analysis showed the correlation and agreement between the actual hepatic venous pressure gradient and the predictive hepatic venous pressure gradient values. A and B: Training set; C and D: Internal testing set; E and F: Temporally independent validation set. HVPG: Hepatic venous pressure gradient; LOA: Limits of agre
- Citation: Guo X, Tong H, Cai WQ, He JY, Han TR, Qian SJ, Quan X, Li Y, Wei B, Wang ZD, Tai Y, Guo DQ, Wu H. Computed tomography-based transformer model for non-invasive prediction of portal venous pressure in chronic liver diseases. World J Gastroenterol 2026; 32(47): 121435
- URL: https://www.wjgnet.com/1007-9327/full/v32/i47/121435.htm
- DOI: https://dx.doi.org/10.3748/wjg.121435