
















Copyright: ©Author(s) 2026.
World J Gastroenterol. Dec 7, 2026; 32(45): 122523
Published online Dec 7, 2026. doi: 10.3748/wjg.122523
Published online Dec 7, 2026. doi: 10.3748/wjg.122523
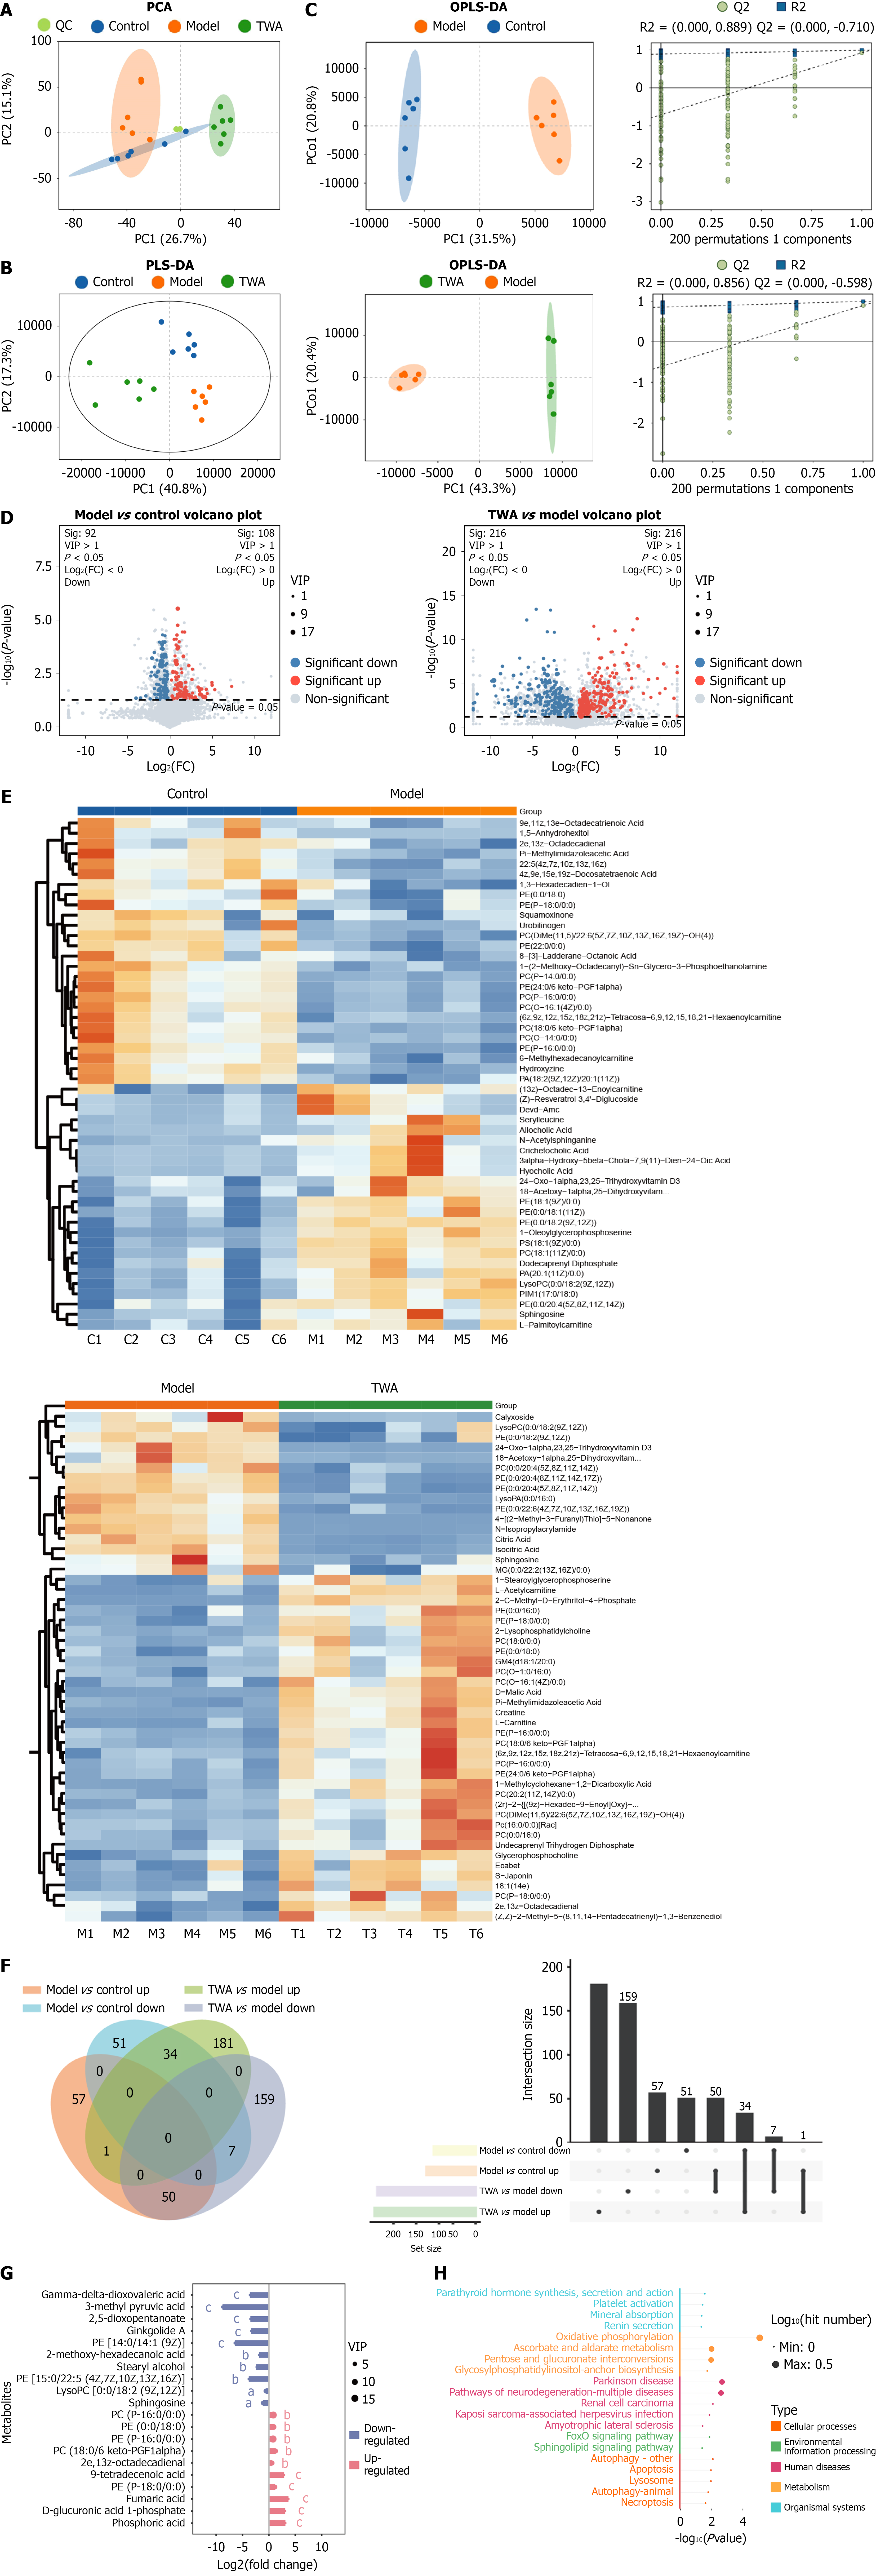
Figure 4 Metabonomics analysis of Tangwei’an treated diabetic gastroparesis mice.
A: Principal component analysis of metabolites; B: PLS-DA analysis of metabolites; C: OPLS-DA analysis model of intergroup differential metabolites; D: Volcano plot of differentially expressed metabolites in metabonomics; E: Heatmap visualization of metabolites in Control, Model, and Tangwei’an groups; F: Venn and UpSet diagram analysis of differentially expressed metabolites; G: Lollipop plot of metabolites in Tangwei’an decoction-treated diabetic gastroparesis; H: Kyoto Encyclopedia of Genes and Genomes analysis of differentially expressed metabolites in Tangwei’an decoction-treated diabetic gastroparesis. aP < 0.05, bP < 0.01, cP < 0.001. TWA: Tangwei’an; VIP: Vasoactive intestinal peptide.
- Citation: Zhang YX, Fang XY, Zhang YJ, Yin RY, Li B, Tian JX. Multi-omics analysis identifies COX6A2/SCF/c-Kit-mediated mitochondrial remodeling as a key mechanism of Tangwei’an decoction in diabetic gastroparesis. World J Gastroenterol 2026; 32(45): 122523
- URL: https://www.wjgnet.com/1007-9327/full/v32/i45/122523.htm
- DOI: https://dx.doi.org/10.3748/wjg.122523