
















Copyright: ©Author(s) 2026.
World J Gastroenterol. Dec 7, 2026; 32(45): 122498
Published online Dec 7, 2026. doi: 10.3748/wjg.122498
Published online Dec 7, 2026. doi: 10.3748/wjg.122498
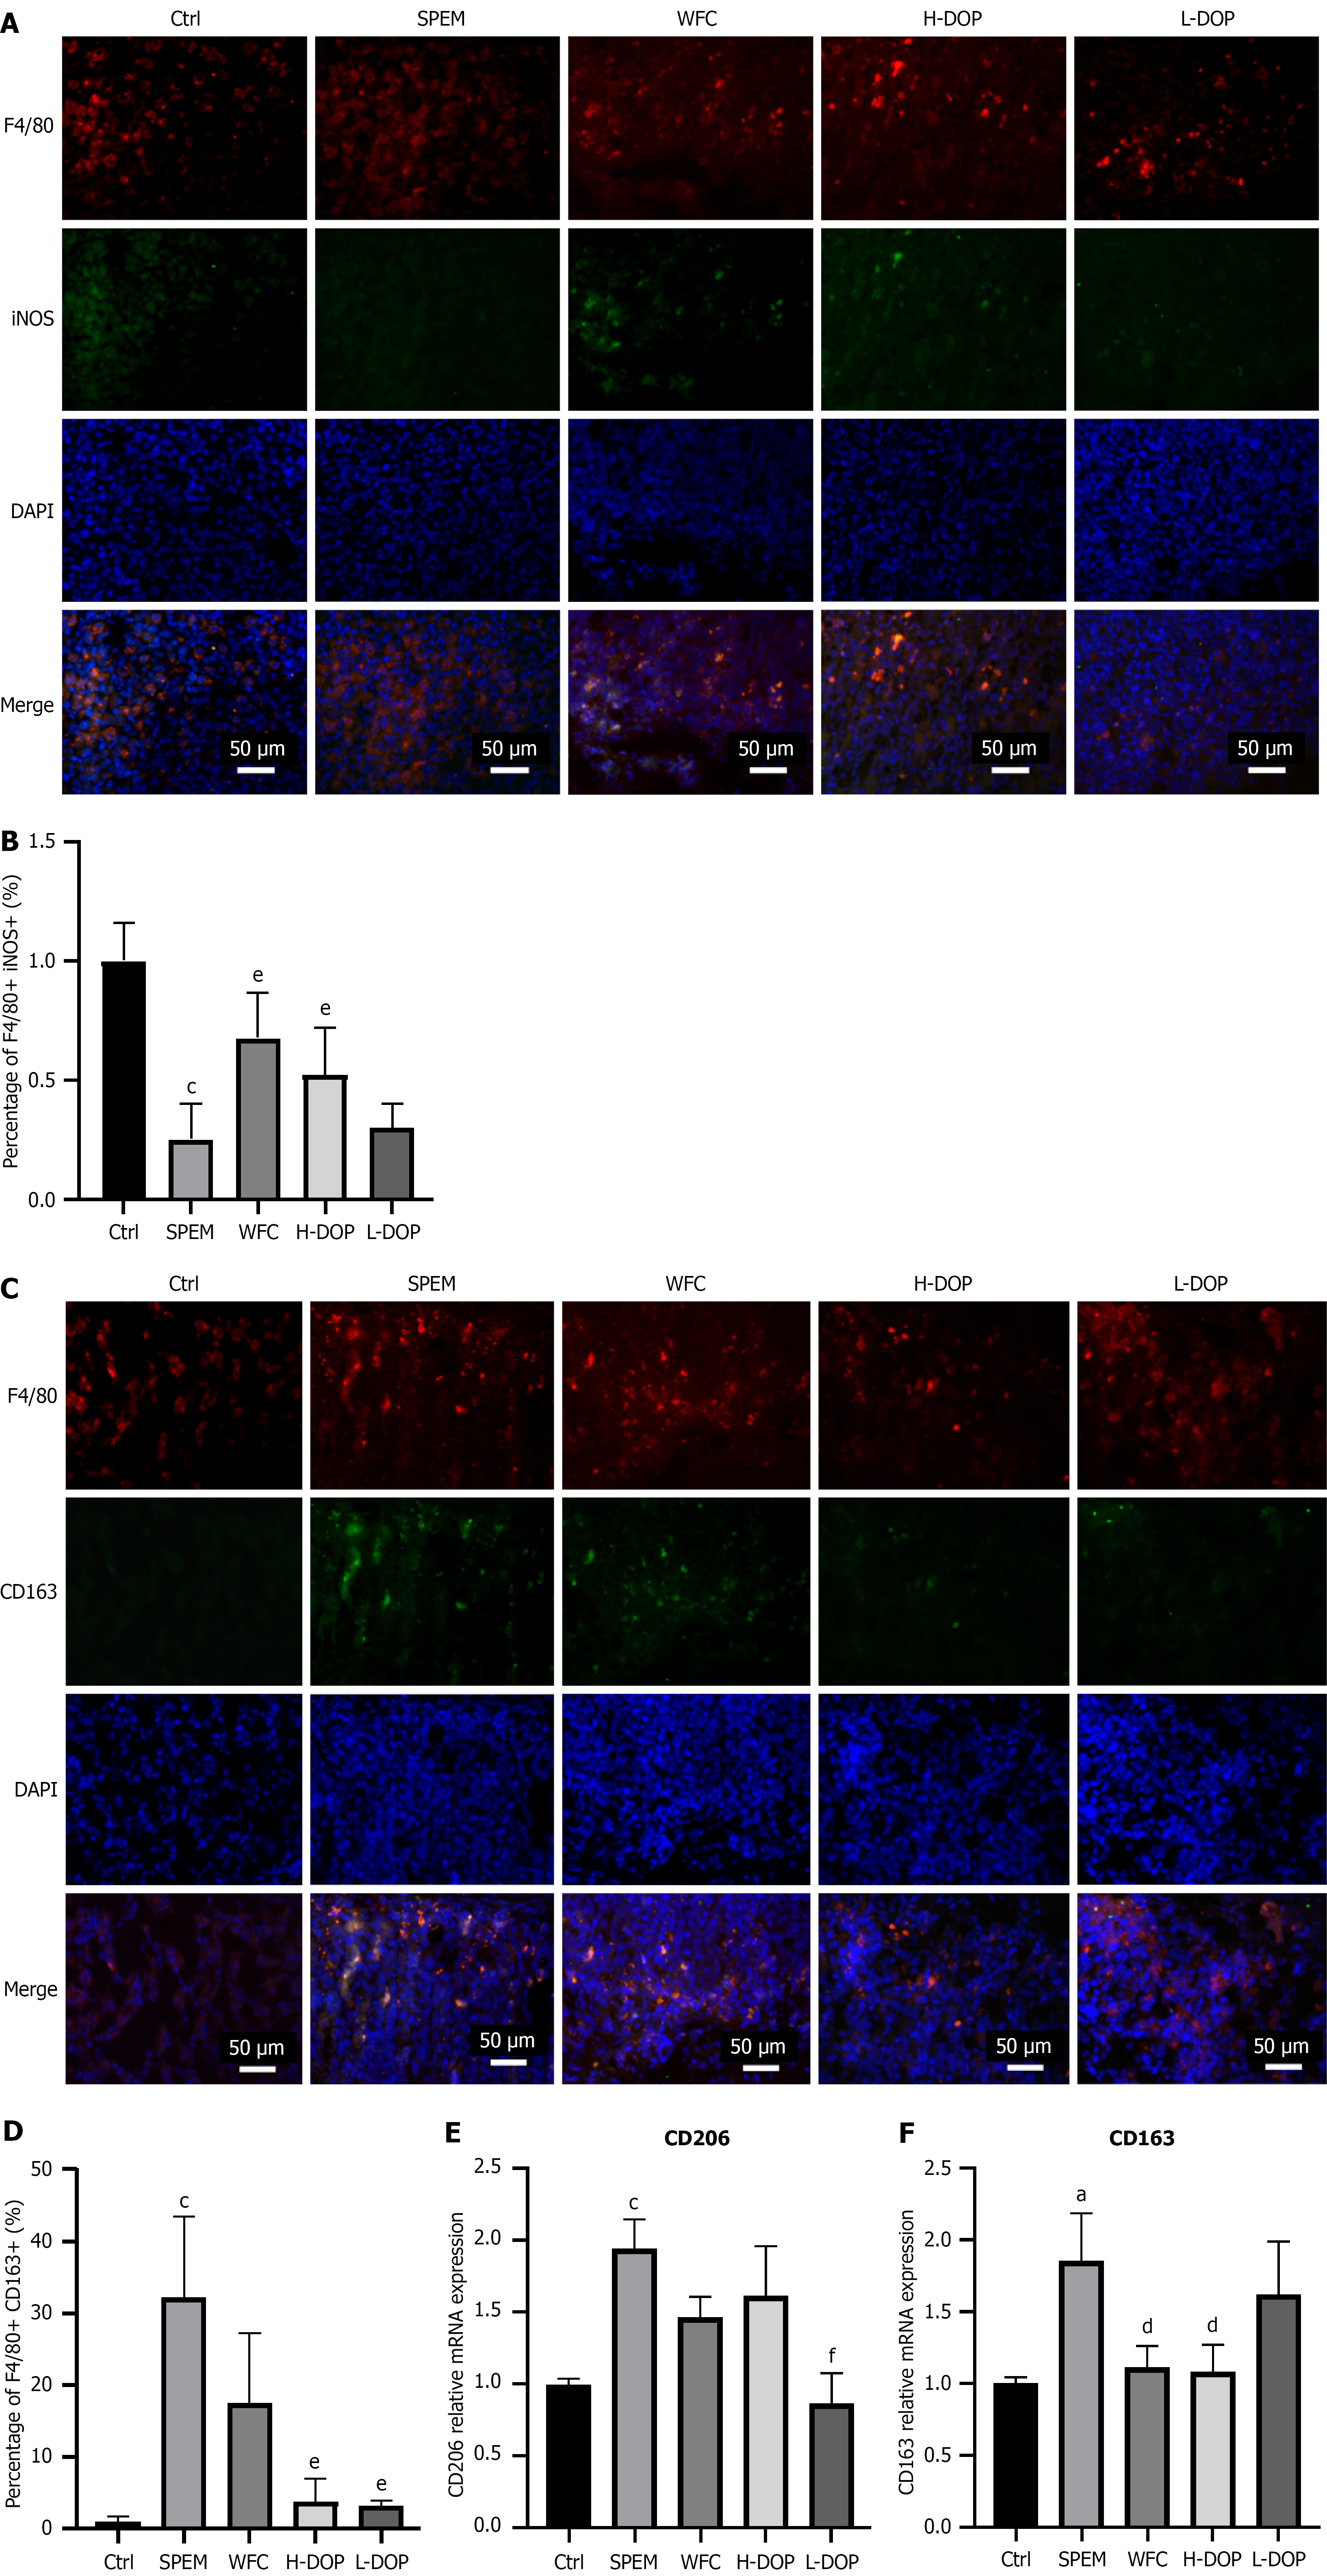
Figure 4 Analysis of M2-macrophages in gastric tissue by immunofluorescence and real-time polymerase chain reaction.
A: Immuno
- Citation: Zhao Y, Lu XF, Liu L, Fang H, Sun S, Liu HN, Sun YZ. Dendrobium officinale polysaccharides attenuates spasmolytic polypeptide-expressing metaplasia via dual modulation of gastric epithelial cell fate and macrophage polarization. World J Gastroenterol 2026; 32(45): 122498
- URL: https://www.wjgnet.com/1007-9327/full/v32/i45/122498.htm
- DOI: https://dx.doi.org/10.3748/wjg.122498