
















Copyright: ©Author(s) 2026.
World J Gastroenterol. Nov 28, 2026; 32(44): 122239
Published online Nov 28, 2026. doi: 10.3748/wjg.122239
Published online Nov 28, 2026. doi: 10.3748/wjg.122239
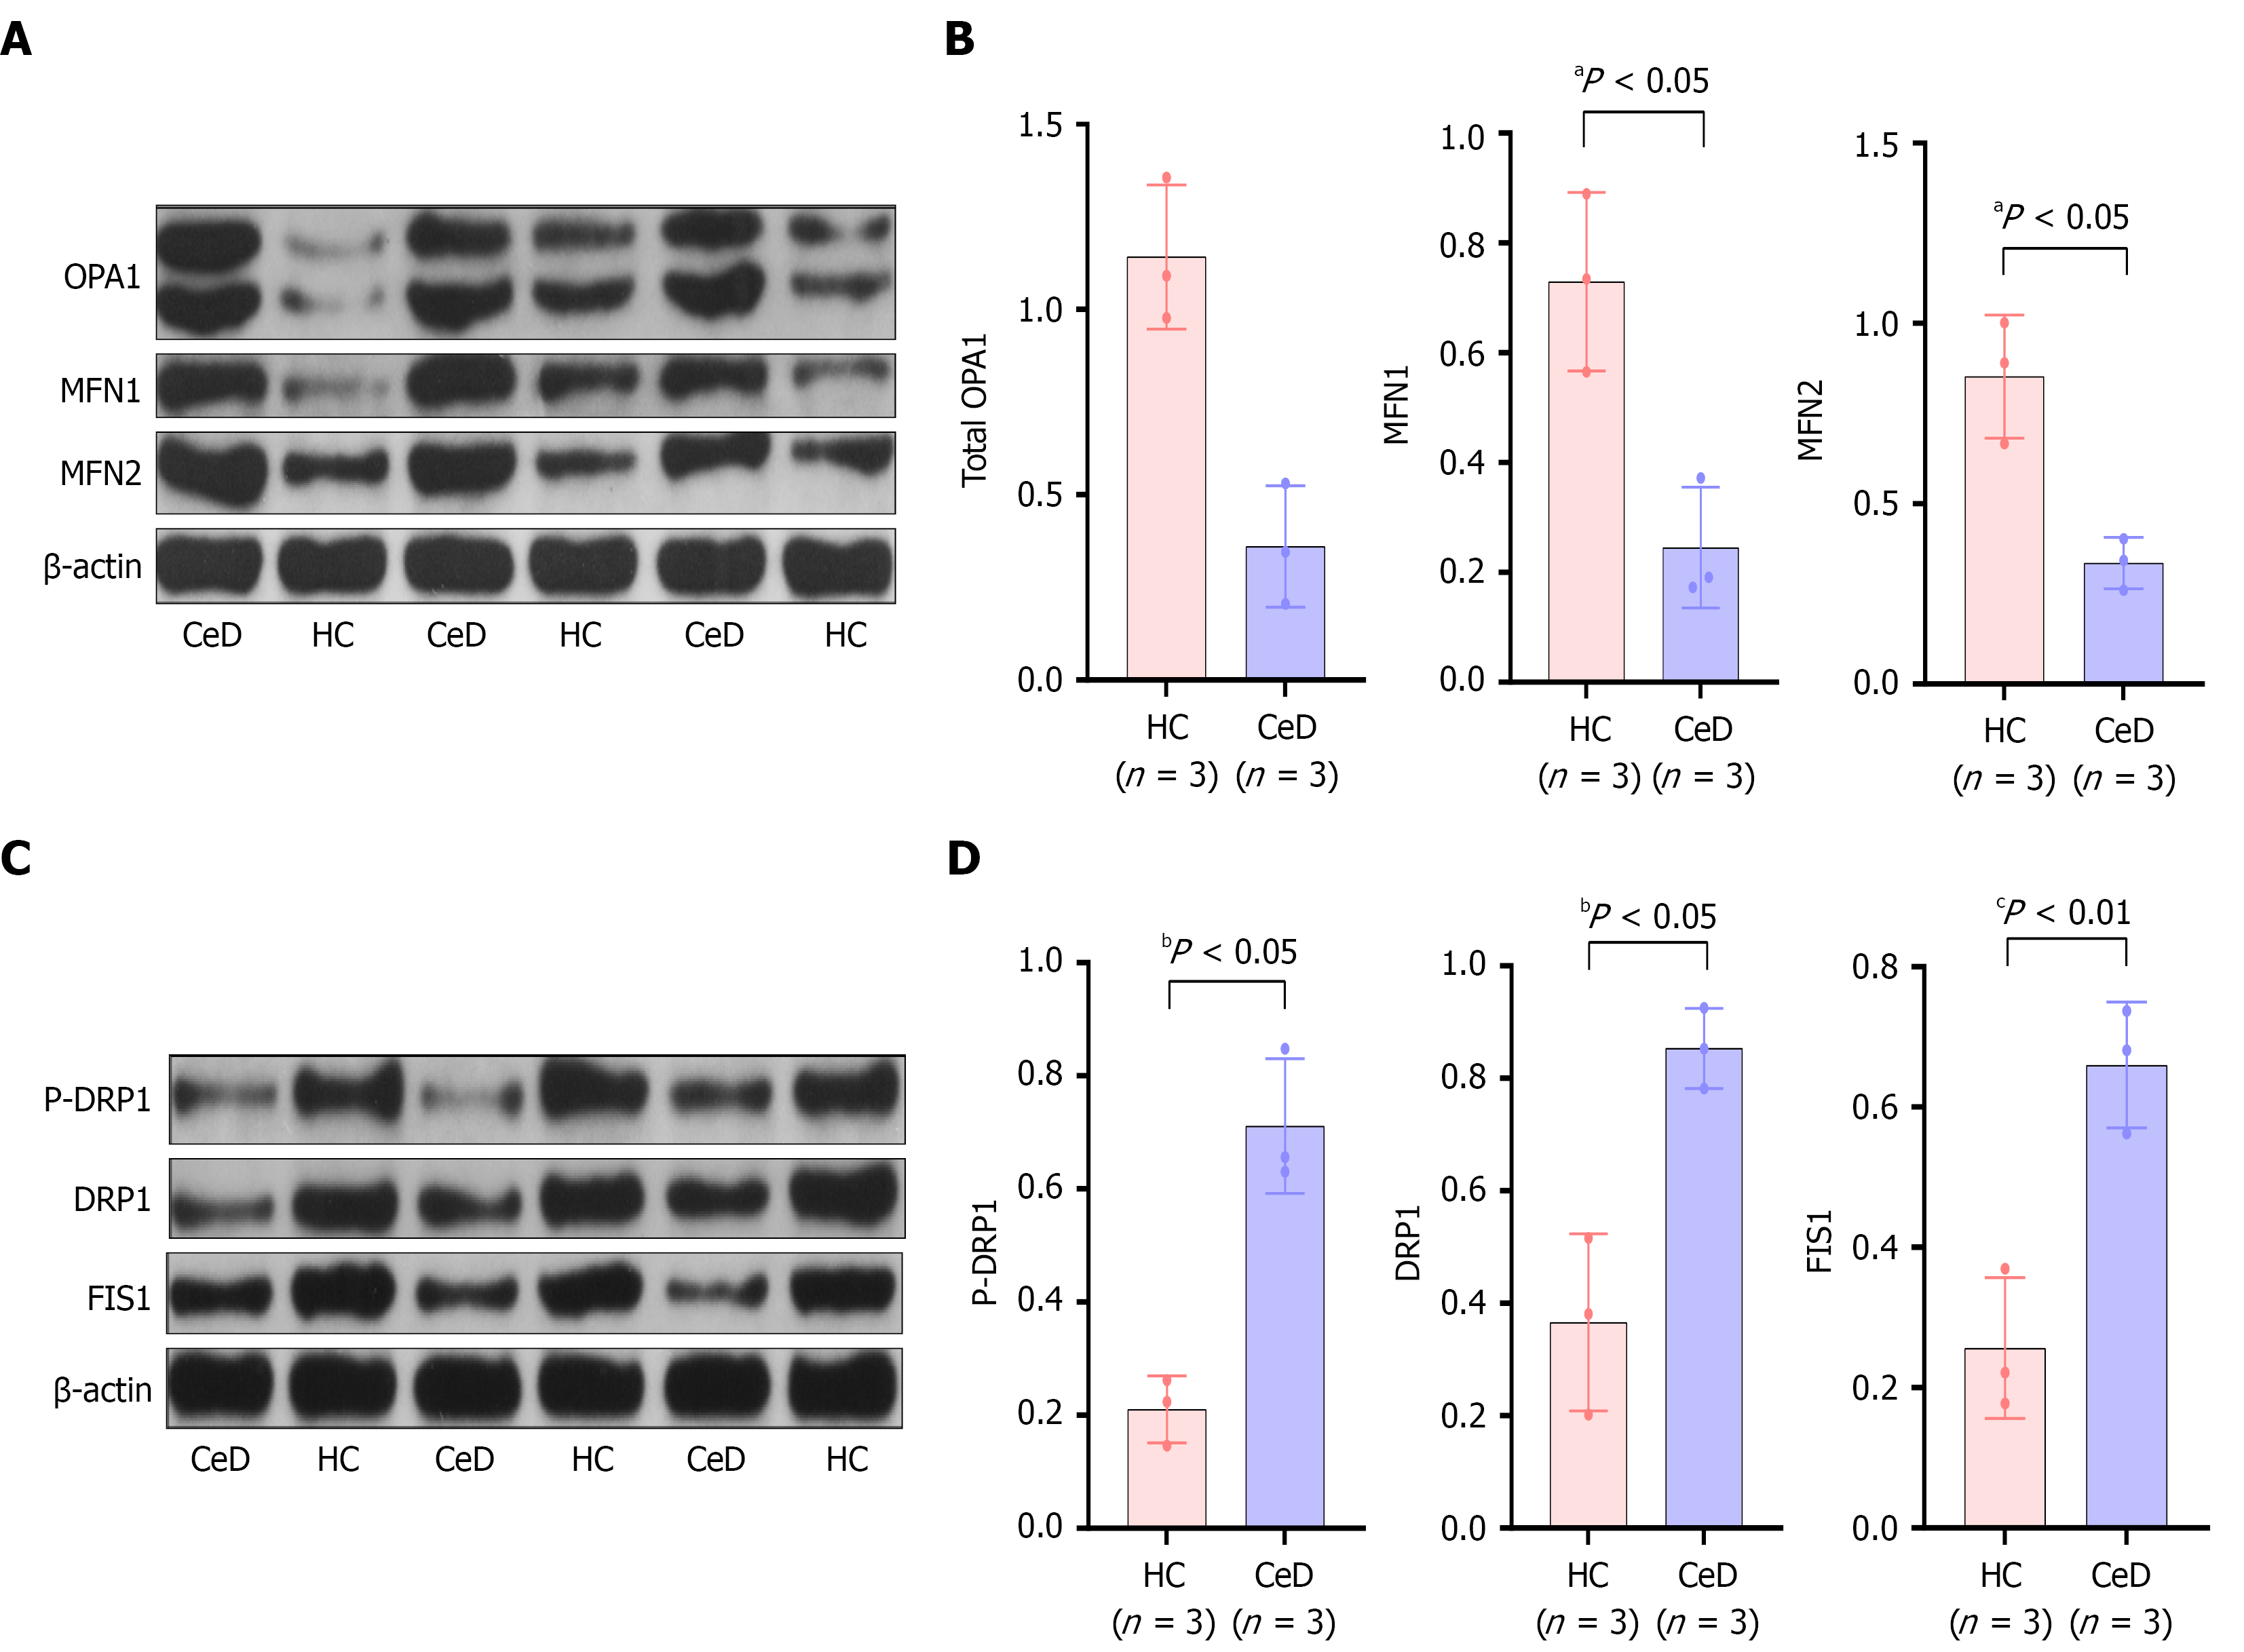
Figure 3 Expression of mitochondrial fusion and fission proteins (n = 3 per group for western blotting).
A: Western blot analysis showed that the fusion proteins OPA1, MFN1, and MFN2 were expressed in the intestinal mucosa of the celiac disease group; B-D: Quantitative analysis of the fusion proteins OPA1 (B), MFN1 (C), and MFN2 (D); E: Western blot analysis showed that the fission-promoting proteins DRP1, p-DRP1 (the activated form), and FIS1 were expressed in the intestinal mucosa of the celiac disease group; F-H: Quantitative analysis of the fission-promoting proteins p-DRP1 (F), DRP1 (G), and FIS1 (H). Bar charts represent relative protein expression normalized to β-actin (n = 3 per group). Data are presented as mean ± SD. β-actin was used as a loading control. HC: Healthy control; CeD: Celiac disease.
- Citation: Habudai B, Xue SL, Kong WJ, Yu L, Shi T, Xie JJ, Maimaiti R, Gao F. Mitochondrial dysfunction in patients with celiac disease: A multidimensional study. World J Gastroenterol 2026; 32(44): 122239
- URL: https://www.wjgnet.com/1007-9327/full/v32/i44/122239.htm
- DOI: https://dx.doi.org/10.3748/wjg.122239