
















Copyright: ©Author(s) 2026.
World J Gastroenterol. Nov 28, 2026; 32(44): 122239
Published online Nov 28, 2026. doi: 10.3748/wjg.122239
Published online Nov 28, 2026. doi: 10.3748/wjg.122239
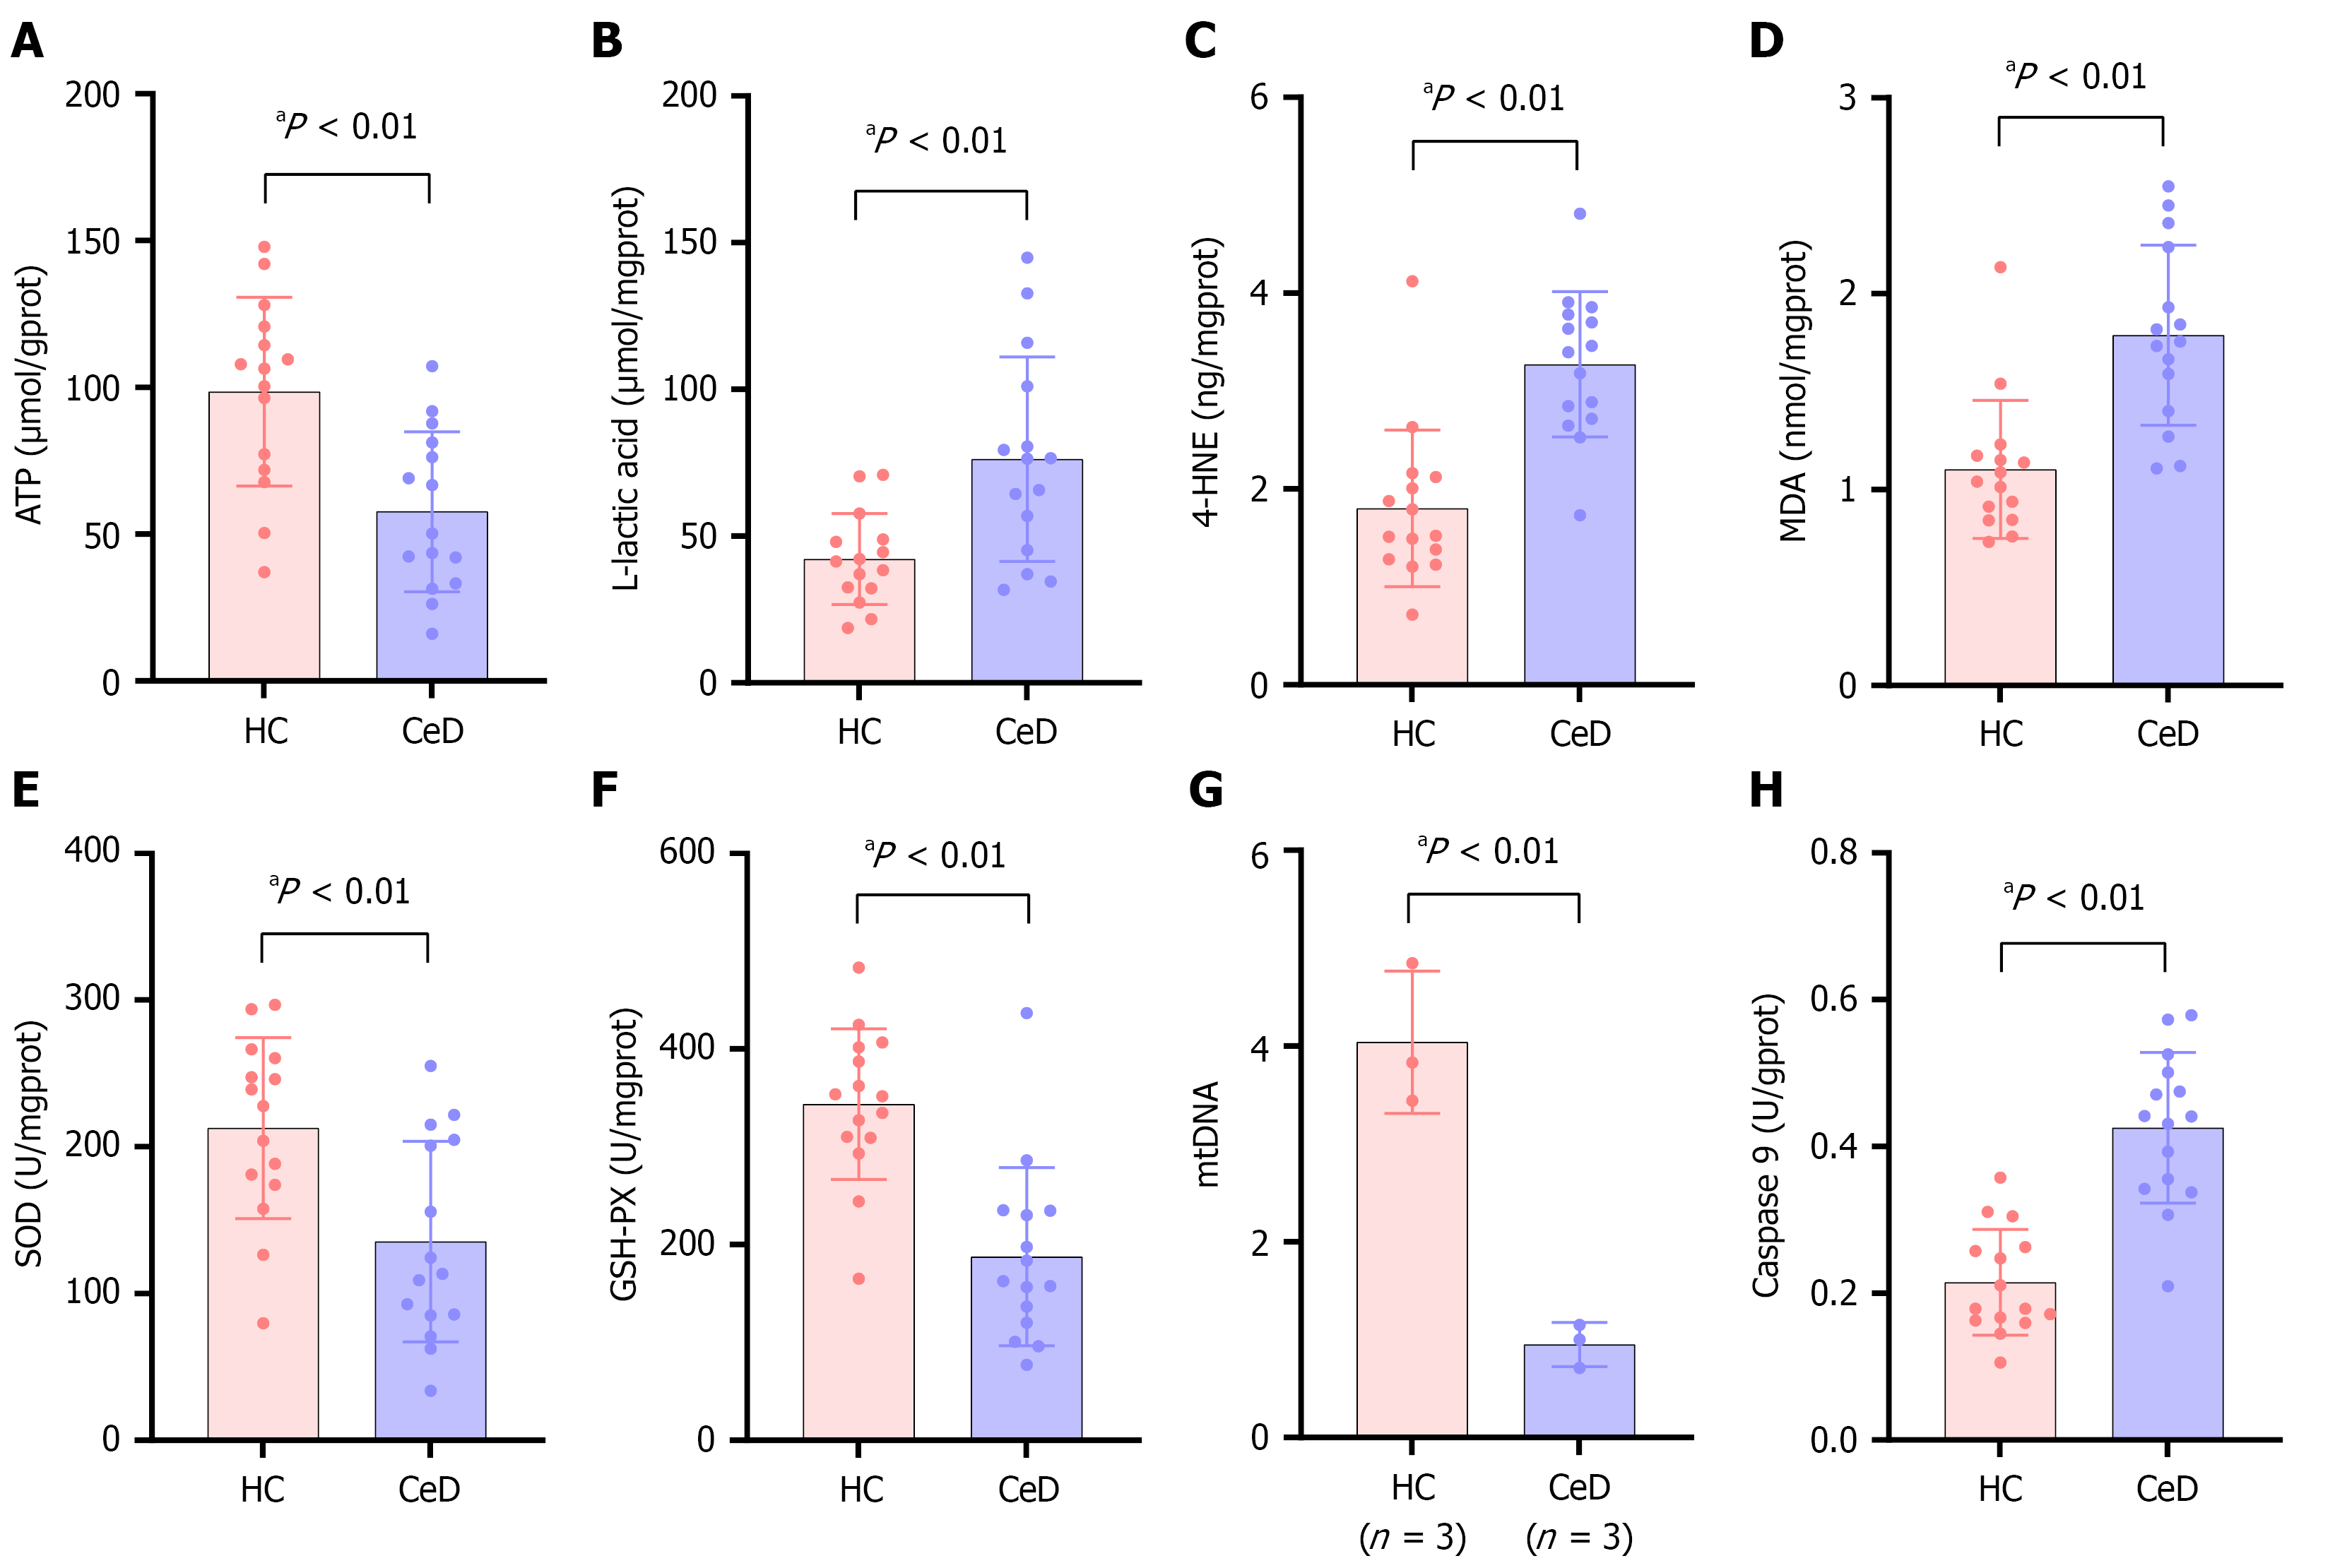
Figure 2 Changes in mitochondrial biochemical indicators, apoptosis, and mitochondrial DNA copy number.
A: Adenosine triphosphate content; B: L-lactate levels; C: 4-hydroxynonenal content; D: Malondialdehyde content; E: Superoxide dismutase activity; F: Glutathione peroxidase activity; G: Mitochondrial DNA copy number; H: Caspase 9 activity. Data are shown as mean ± SD or median (IQR) as appropriate. P values were determined by paired t-test or Wilcoxon signed-rank test. Group sizes: n = 15 per group. ATP: Adenosine triphosphate; 4-HNE: 4-hydroxynonenal; MDA: Malondialdehyde; SOD: Superoxide dismutase; GSH-PX: Glutathione peroxidase; mtDNA: Mitochondrial DNA; HC: Healthy control; CeD: Celiac disease.
- Citation: Habudai B, Xue SL, Kong WJ, Yu L, Shi T, Xie JJ, Maimaiti R, Gao F. Mitochondrial dysfunction in patients with celiac disease: A multidimensional study. World J Gastroenterol 2026; 32(44): 122239
- URL: https://www.wjgnet.com/1007-9327/full/v32/i44/122239.htm
- DOI: https://dx.doi.org/10.3748/wjg.122239