
















Copyright: ©Author(s) 2026.
World J Gastroenterol. Nov 28, 2026; 32(44): 121637
Published online Nov 28, 2026. doi: 10.3748/wjg.121637
Published online Nov 28, 2026. doi: 10.3748/wjg.121637
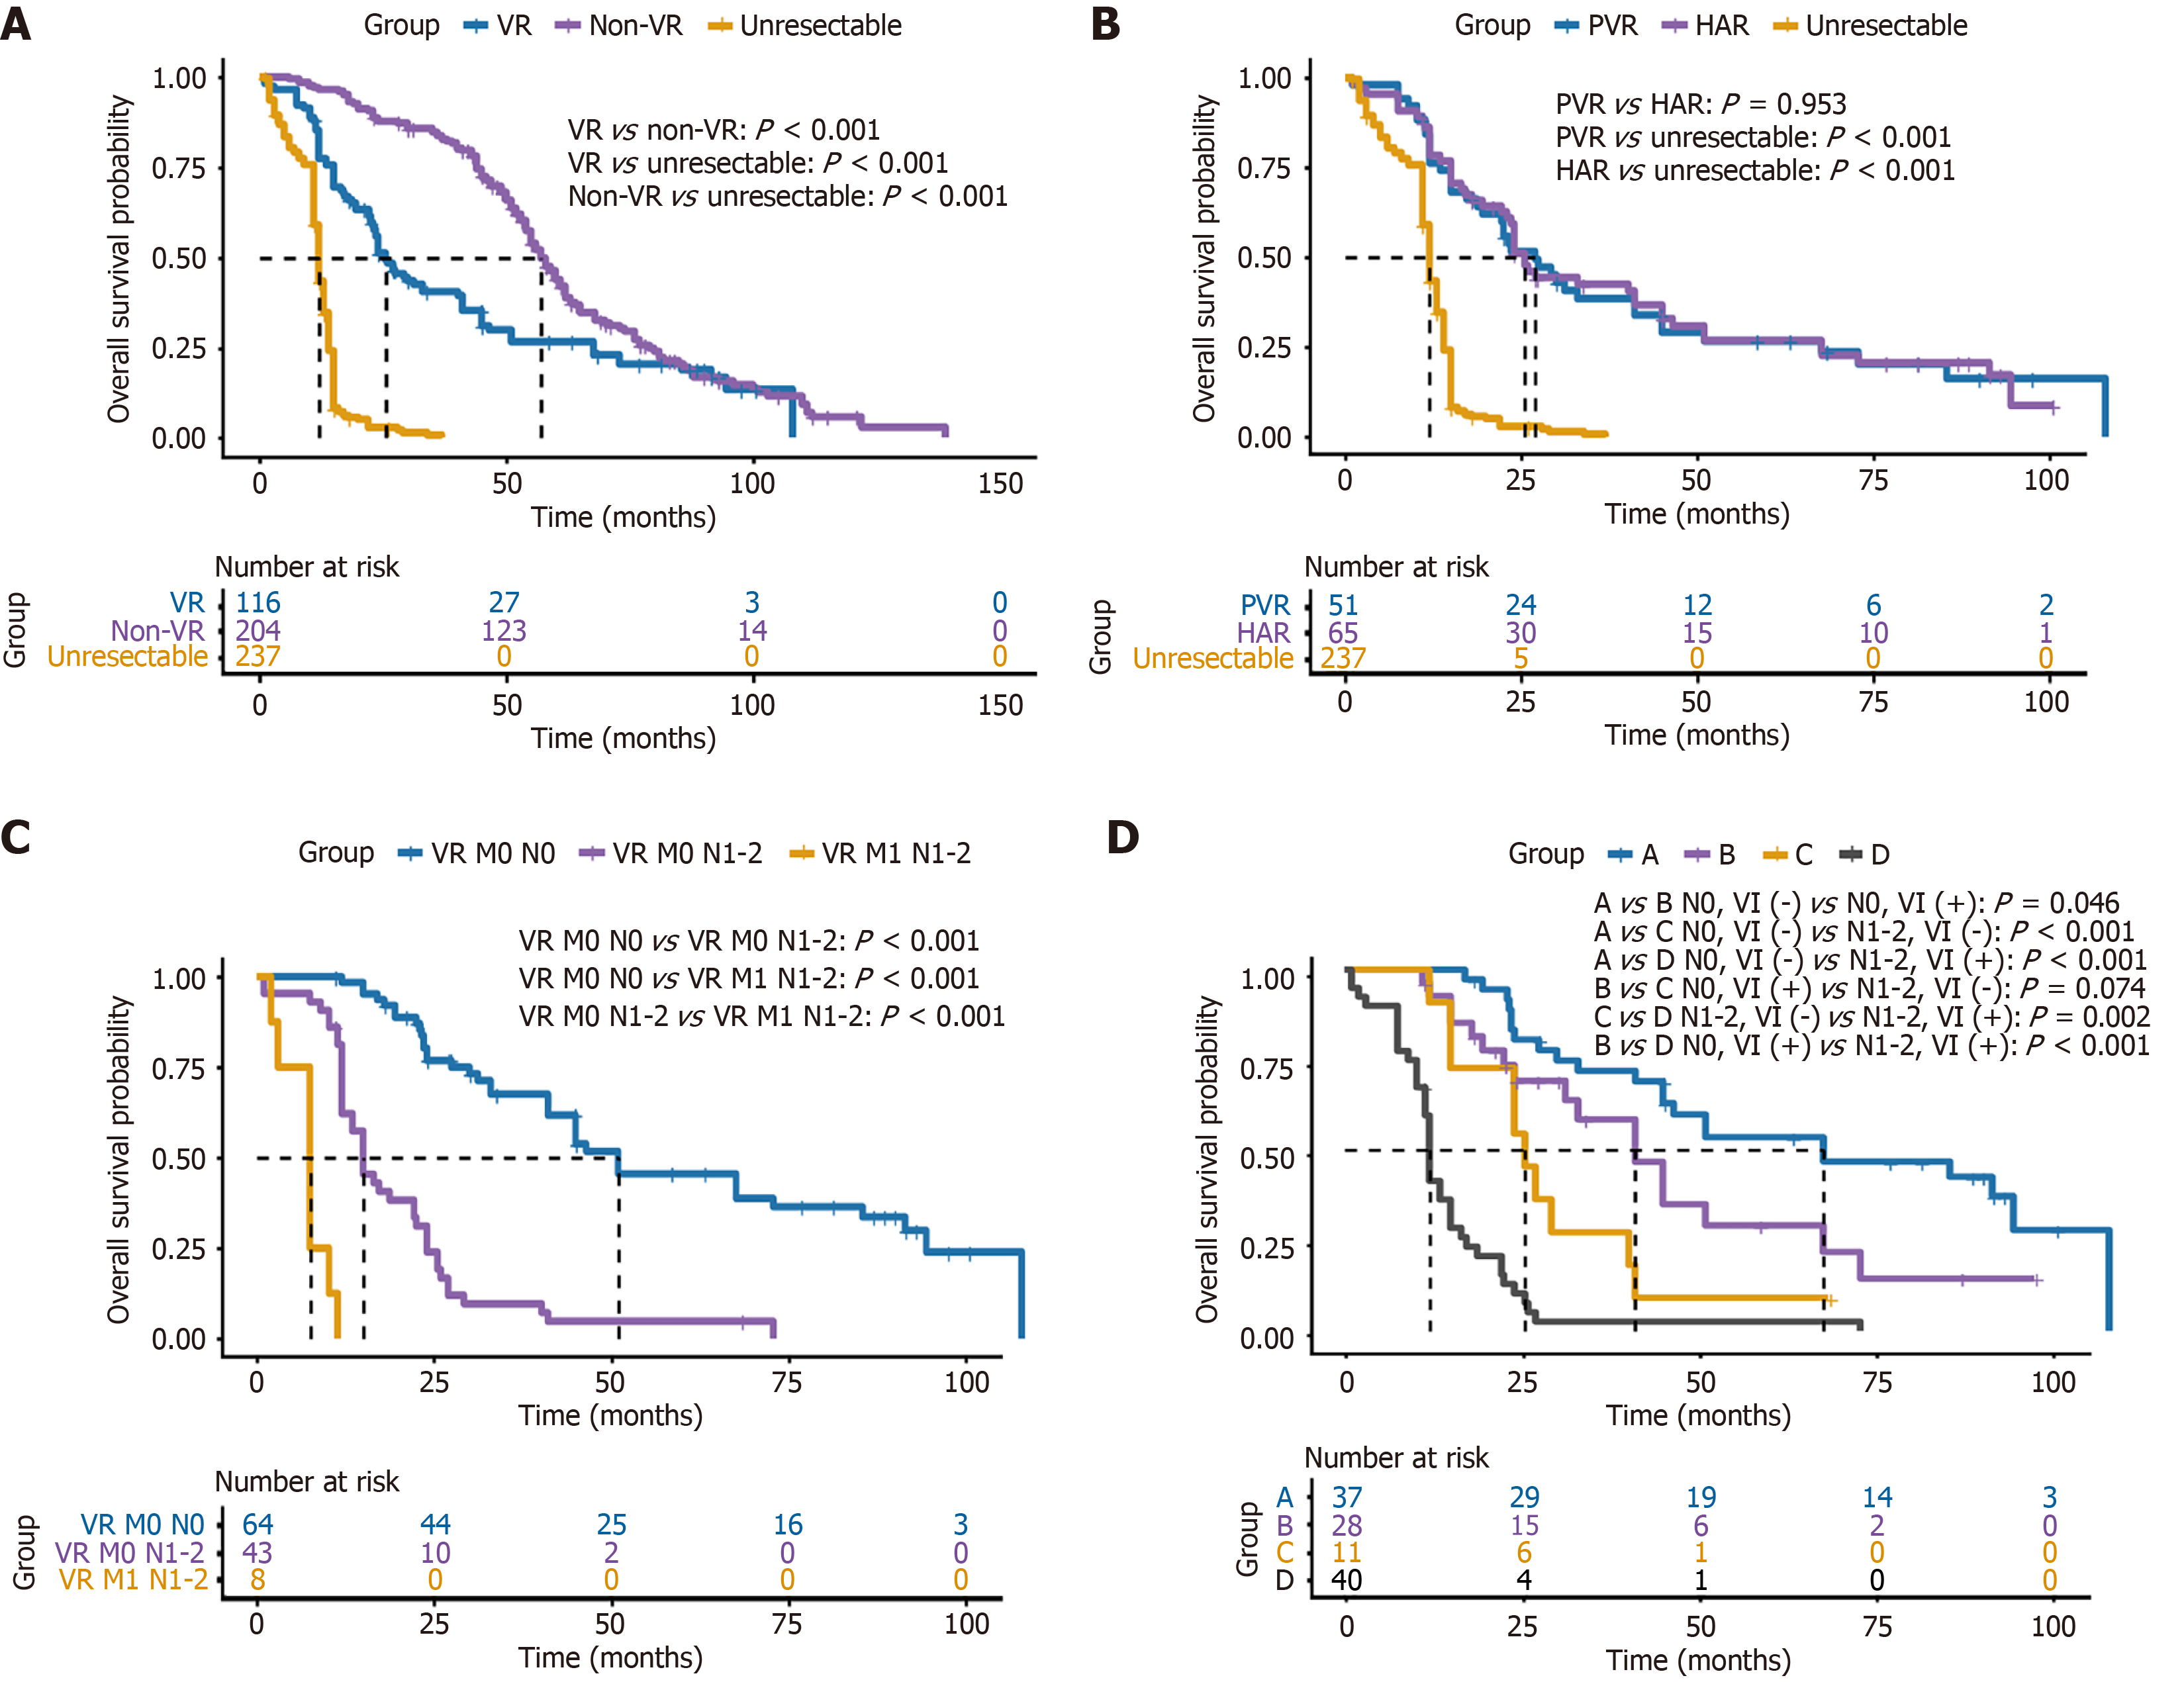
Figure 2 Overall survival according to resection status and vascular resection subgroups.
A: Kaplan-Meier curves comparing overall survival among patients undergoing vascular resection (VR), non-vascular resection, and unresectable cases; B: Overall survival stratified by portal vein resection, hepatic artery resection, and unresectable cases (P values shown); C: Overall survival within the VR cohort stratified by combined distant metastasis status (M)/nodal status (N) categories (VR M0 N0, VR M0 N1-2, and VR M1 N1-2); D: Overall survival of four groups defined by nodal status (N0/N1-2) and vascular invasion (VI) status [A indicates N0/VI (-), B indicates N0/VI (+), C indicates N1-2/VI (-), and D indicates N1-2/VI (+)]. VR: Vascular resection; Non-VR: Non-vascular resection; PVR: Portal vein resection; HAR: Hepatic artery resection; M: Distant metastasis status; N: Nodal status; VI: Vascular invasion.
- Citation: Gao X, Peng F, Su JK, Kuai YY, Chen JS, Yan XM, Liu WZ, Li DY, Peng C, He RZ, Chen YJ. Combined vascular resection and reconstruction for locally advanced perihilar cholangiocarcinoma: A multicenter study. World J Gastroenterol 2026; 32(44): 121637
- URL: https://www.wjgnet.com/1007-9327/full/v32/i44/121637.htm
- DOI: https://dx.doi.org/10.3748/wjg.121637