
















Copyright: ©Author(s) 2026.
World J Gastroenterol. Nov 28, 2026; 32(44): 120795
Published online Nov 28, 2026. doi: 10.3748/wjg.120795
Published online Nov 28, 2026. doi: 10.3748/wjg.120795
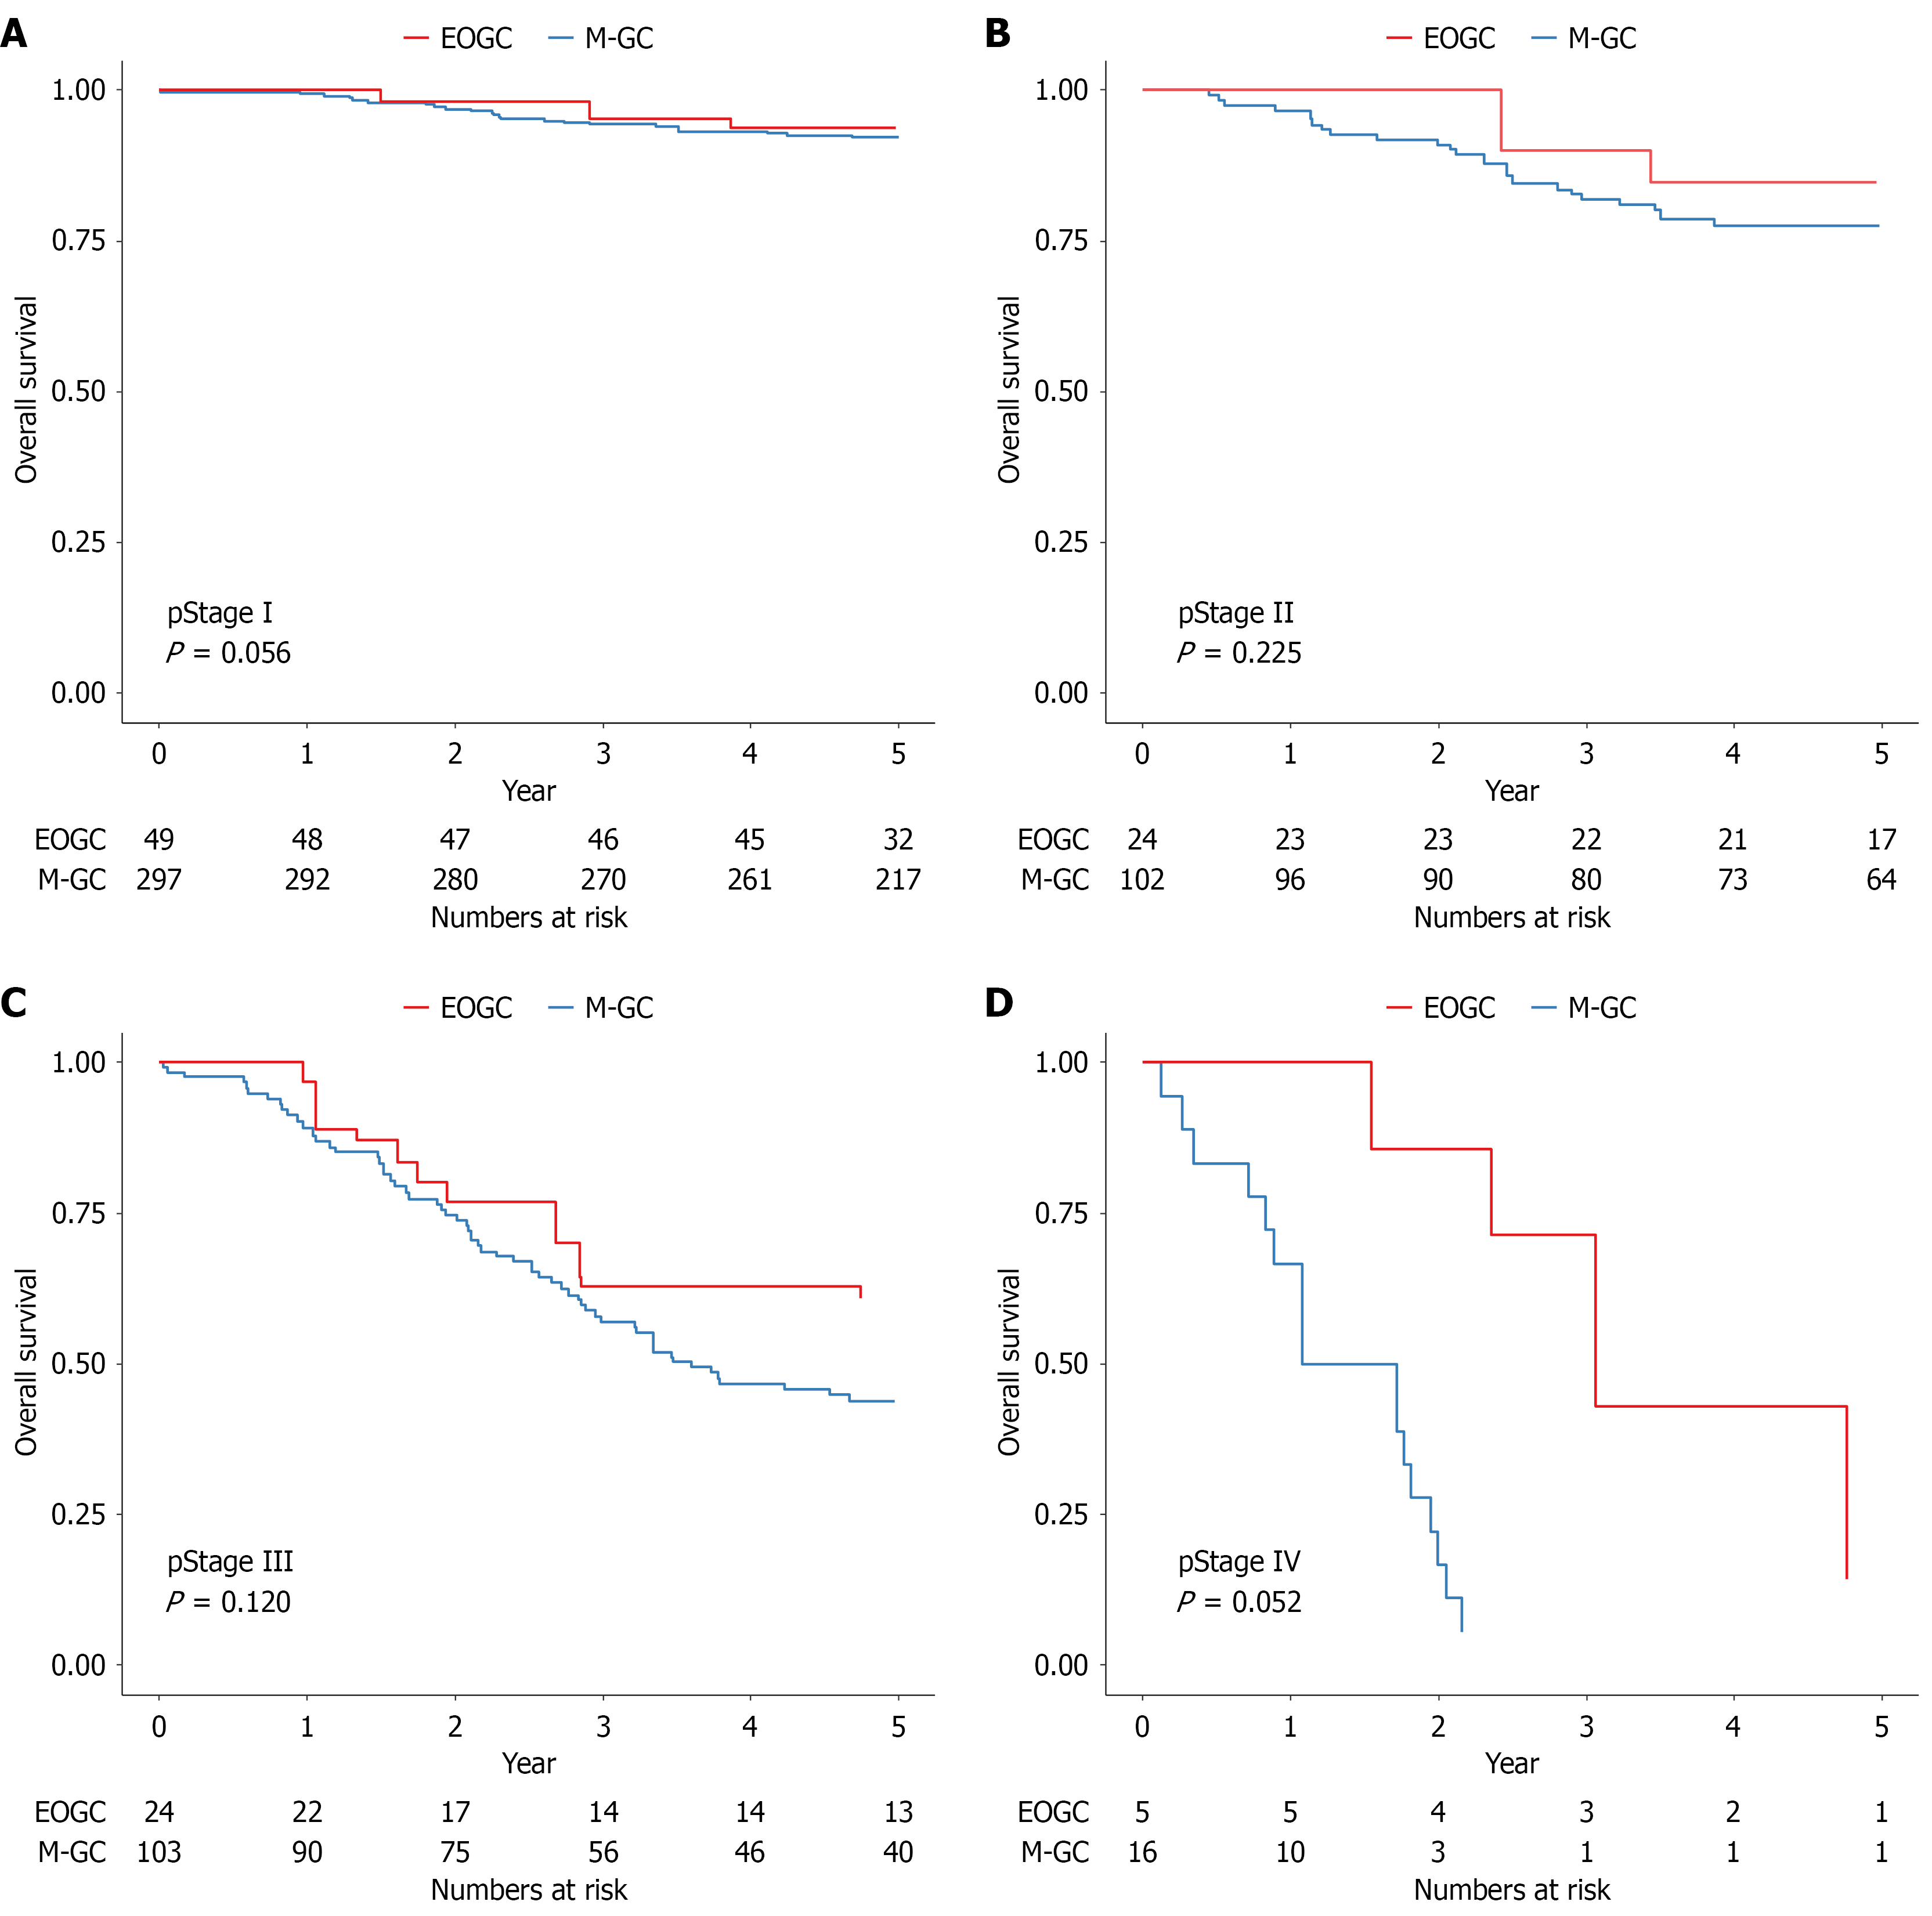
Figure 4 Kaplan-Meier curves for overall survival by pathological stage after inverse probability of treatment weighting.
A: Stage I: 5-year overall survival (OS), 93.74% vs 92.19% in early-onset gastric cancer (EOGC) and mid-aged gastric cancer (M-GC), respectively (P = 0.056); B: Stage II: 5-year OS, 84.86% vs 77.62% in EOGC and M-GC, respectively (P = 0.225); C: Stage III: 5-year OS, 60.86% vs 43.75% in EOGC and M-GC, respectively (P = 0.120); D: Stage IV: 5-year OS, 14.29% vs 5.56% in EOGC and M-GC, respectively (P = 0.052). M-GC: Mid-aged gastric cancer; EOGC: Early-onset gastric cancer.
- Citation: Jeong SA, Lee JB, Kim JH. Clinicopathological characteristics and survival outcomes of early-onset vs mid-aged gastric cancer using an evidence-based age cutoff. World J Gastroenterol 2026; 32(44): 120795
- URL: https://www.wjgnet.com/1007-9327/full/v32/i44/120795.htm
- DOI: https://dx.doi.org/10.3748/wjg.120795