
















Copyright: ©Author(s) 2026.
World J Gastroenterol. Nov 21, 2026; 32(43): 122243
Published online Nov 21, 2026. doi: 10.3748/wjg.122243
Published online Nov 21, 2026. doi: 10.3748/wjg.122243
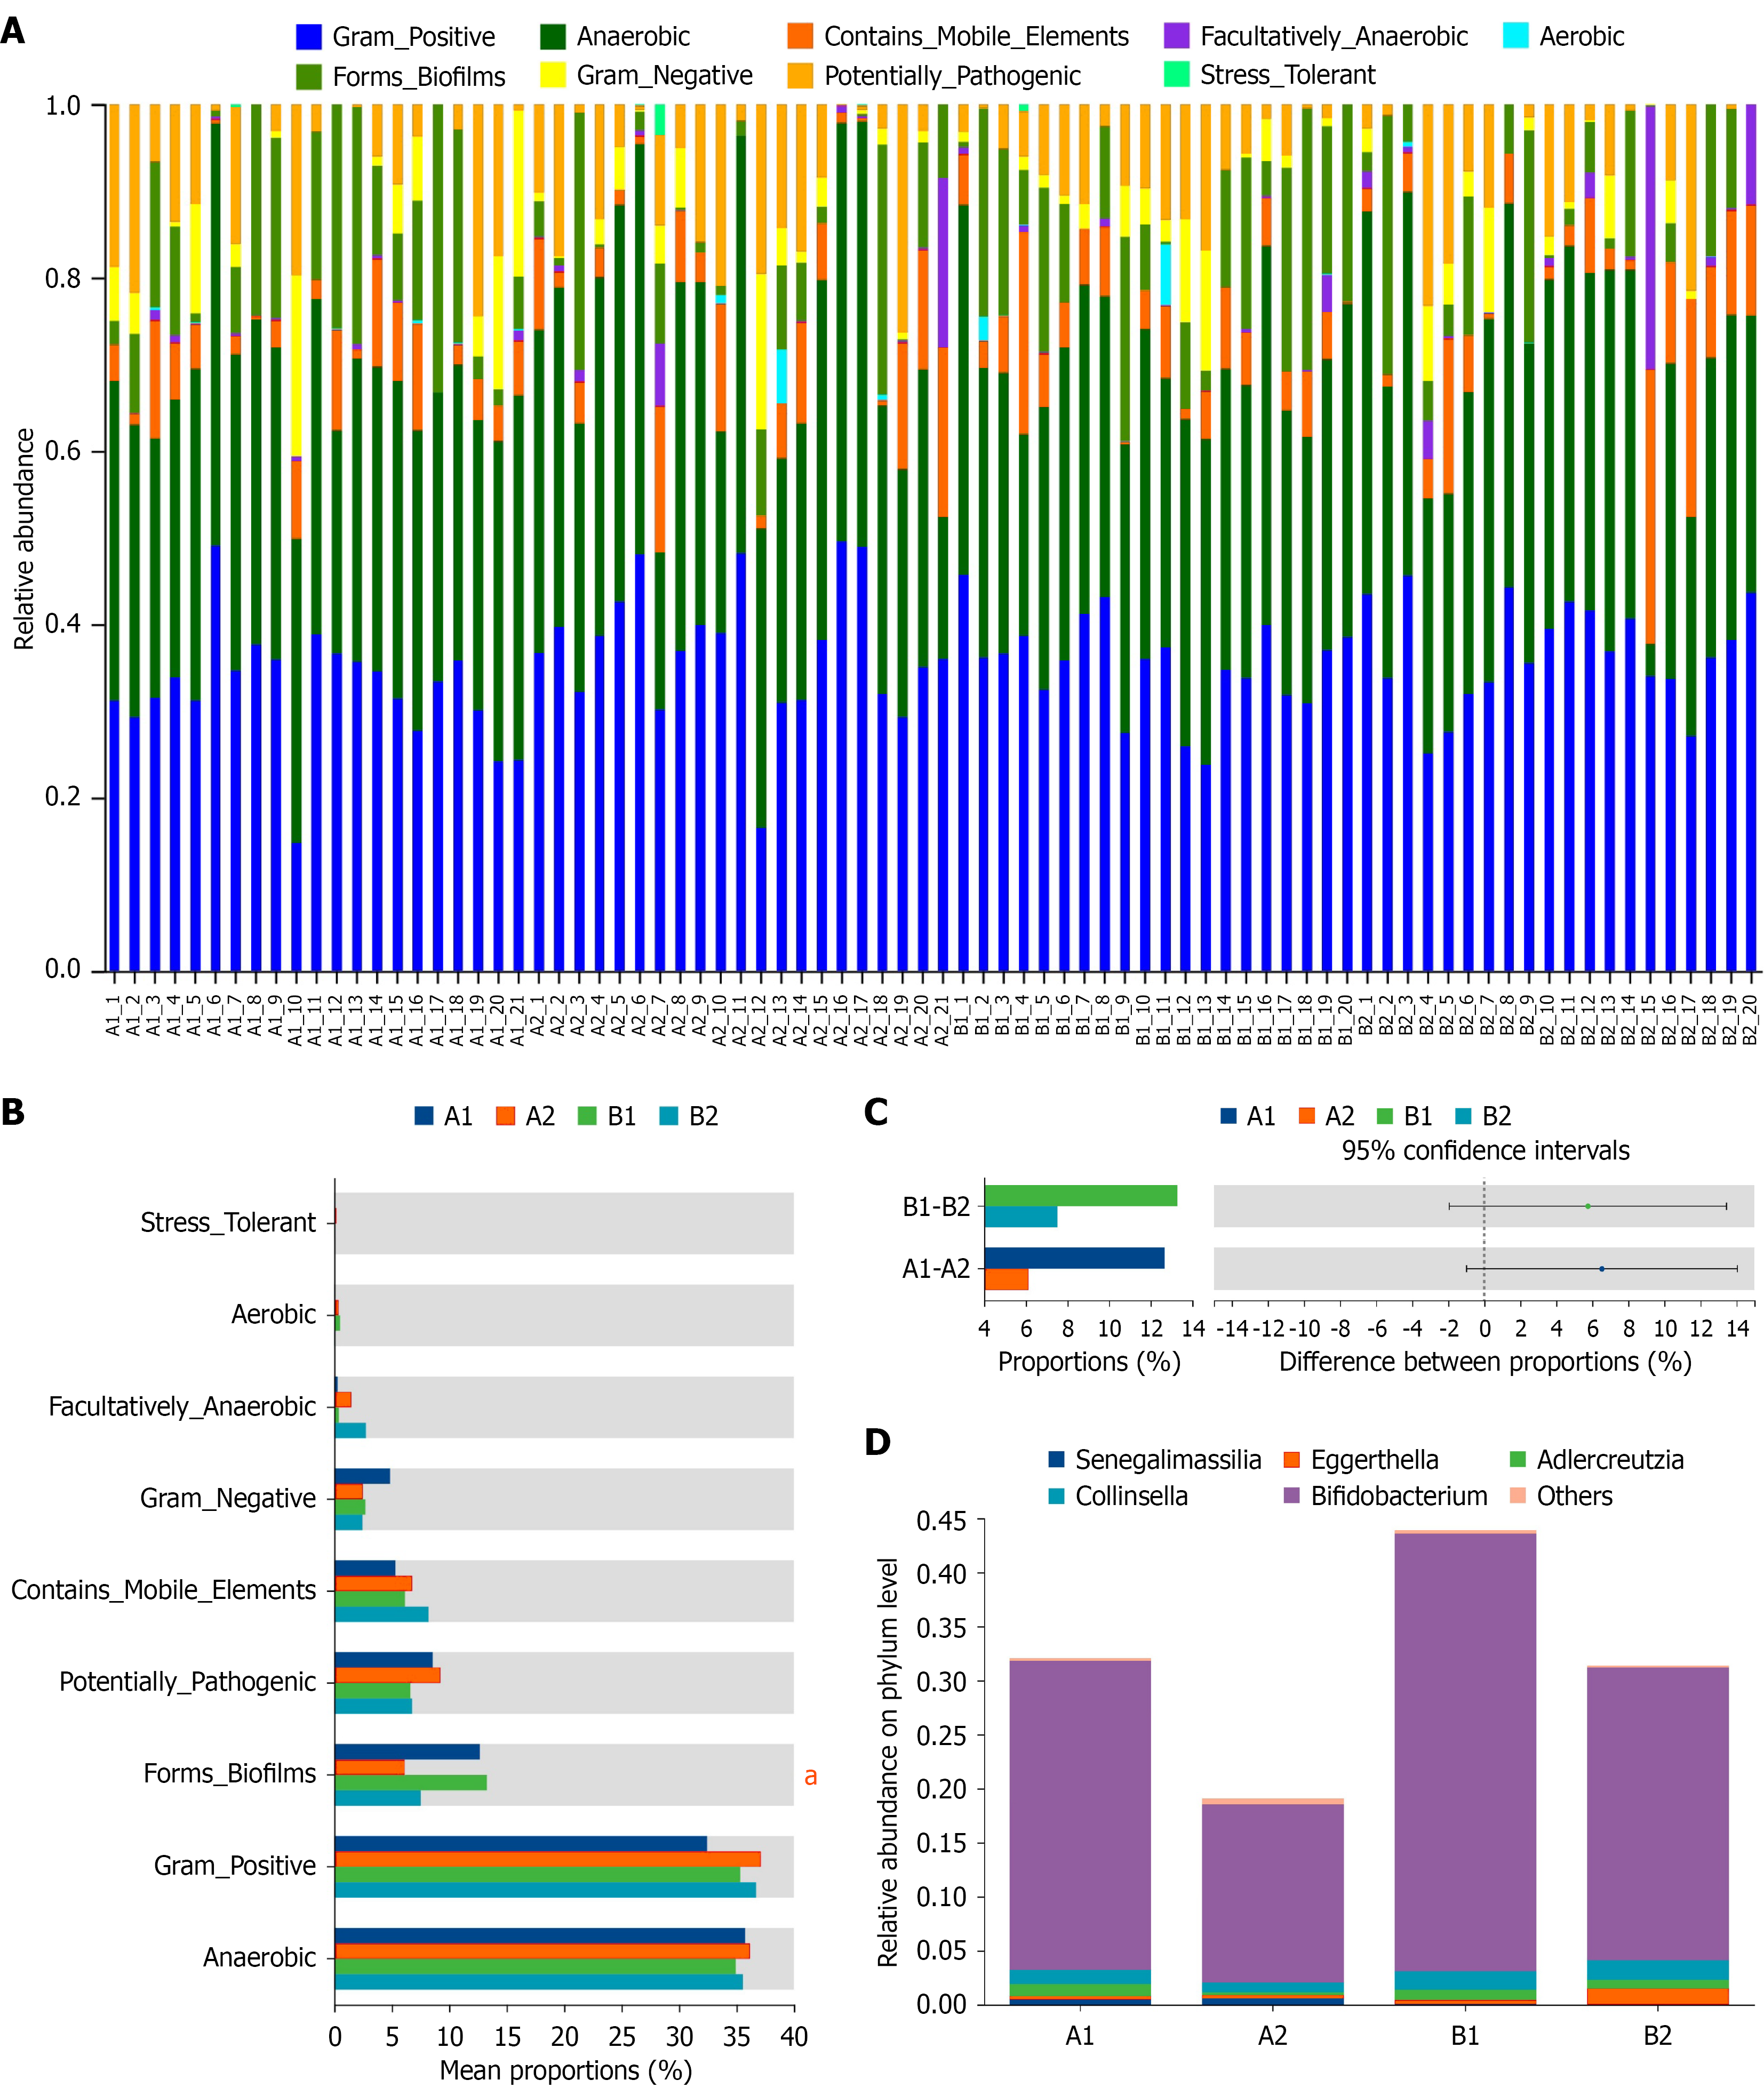
Figure 5 Phenotypic prediction of intestinal microbiota.
A: Variations in composition of phenotypes. The X-axis represents sample names, and the Y-axis represents relative abundance. The color gradient of the blocks shows the phenotypic categories; B: Kruskal-Wallis H test on phenotype. The X-axis represents the phenotypic categories, and the Y-axis shows the percentage value of the relative abundance of each phenotype in the samples. Different colors correspond to different groups. The rightmost column displays P values, aP < 0.05; C: Kruskal-Wallis H test for forms biofilms phenotype. The X-axis represents phenotypic categories, and the Y-axis indicates the percentage of relative abundance for each phenotype in samples. Different colors represent different groups; D: Prediction of species contribution to forms biofilms phenotype. This figure displays the dominant species composition of forms biofilms phenotypes, and reflects the matching relationship between species and forms biofilms phenotypes. The X-axis shows group names, different colors in the legend represent distinct species, the Y-axis represents the relative abundance values of each species under the target phenotype. The top 5 genera are shown. Group A (berberine group): A1, before treatment; A2, after treatment. Group B (clarithromycin group): B1, before treatment; B2, after treatment. BBR: Berberine; CLA: Clarithromycin.
- Citation: Cai TW, Chen ZK, Lv ZY, Jiang WJ, Sun YY, Jin LX, Xia CM, Li QQ, Chen X. Effects of berberine-containing vs clarithromycin-containing quadruple therapy on intestinal microbiota during Helicobacter pylori eradication. World J Gastroenterol 2026; 32(43): 122243
- URL: https://www.wjgnet.com/1007-9327/full/v32/i43/122243.htm
- DOI: https://dx.doi.org/10.3748/wjg.122243