
















Copyright: ©Author(s) 2026.
World J Gastroenterol. Nov 21, 2026; 32(43): 122243
Published online Nov 21, 2026. doi: 10.3748/wjg.122243
Published online Nov 21, 2026. doi: 10.3748/wjg.122243
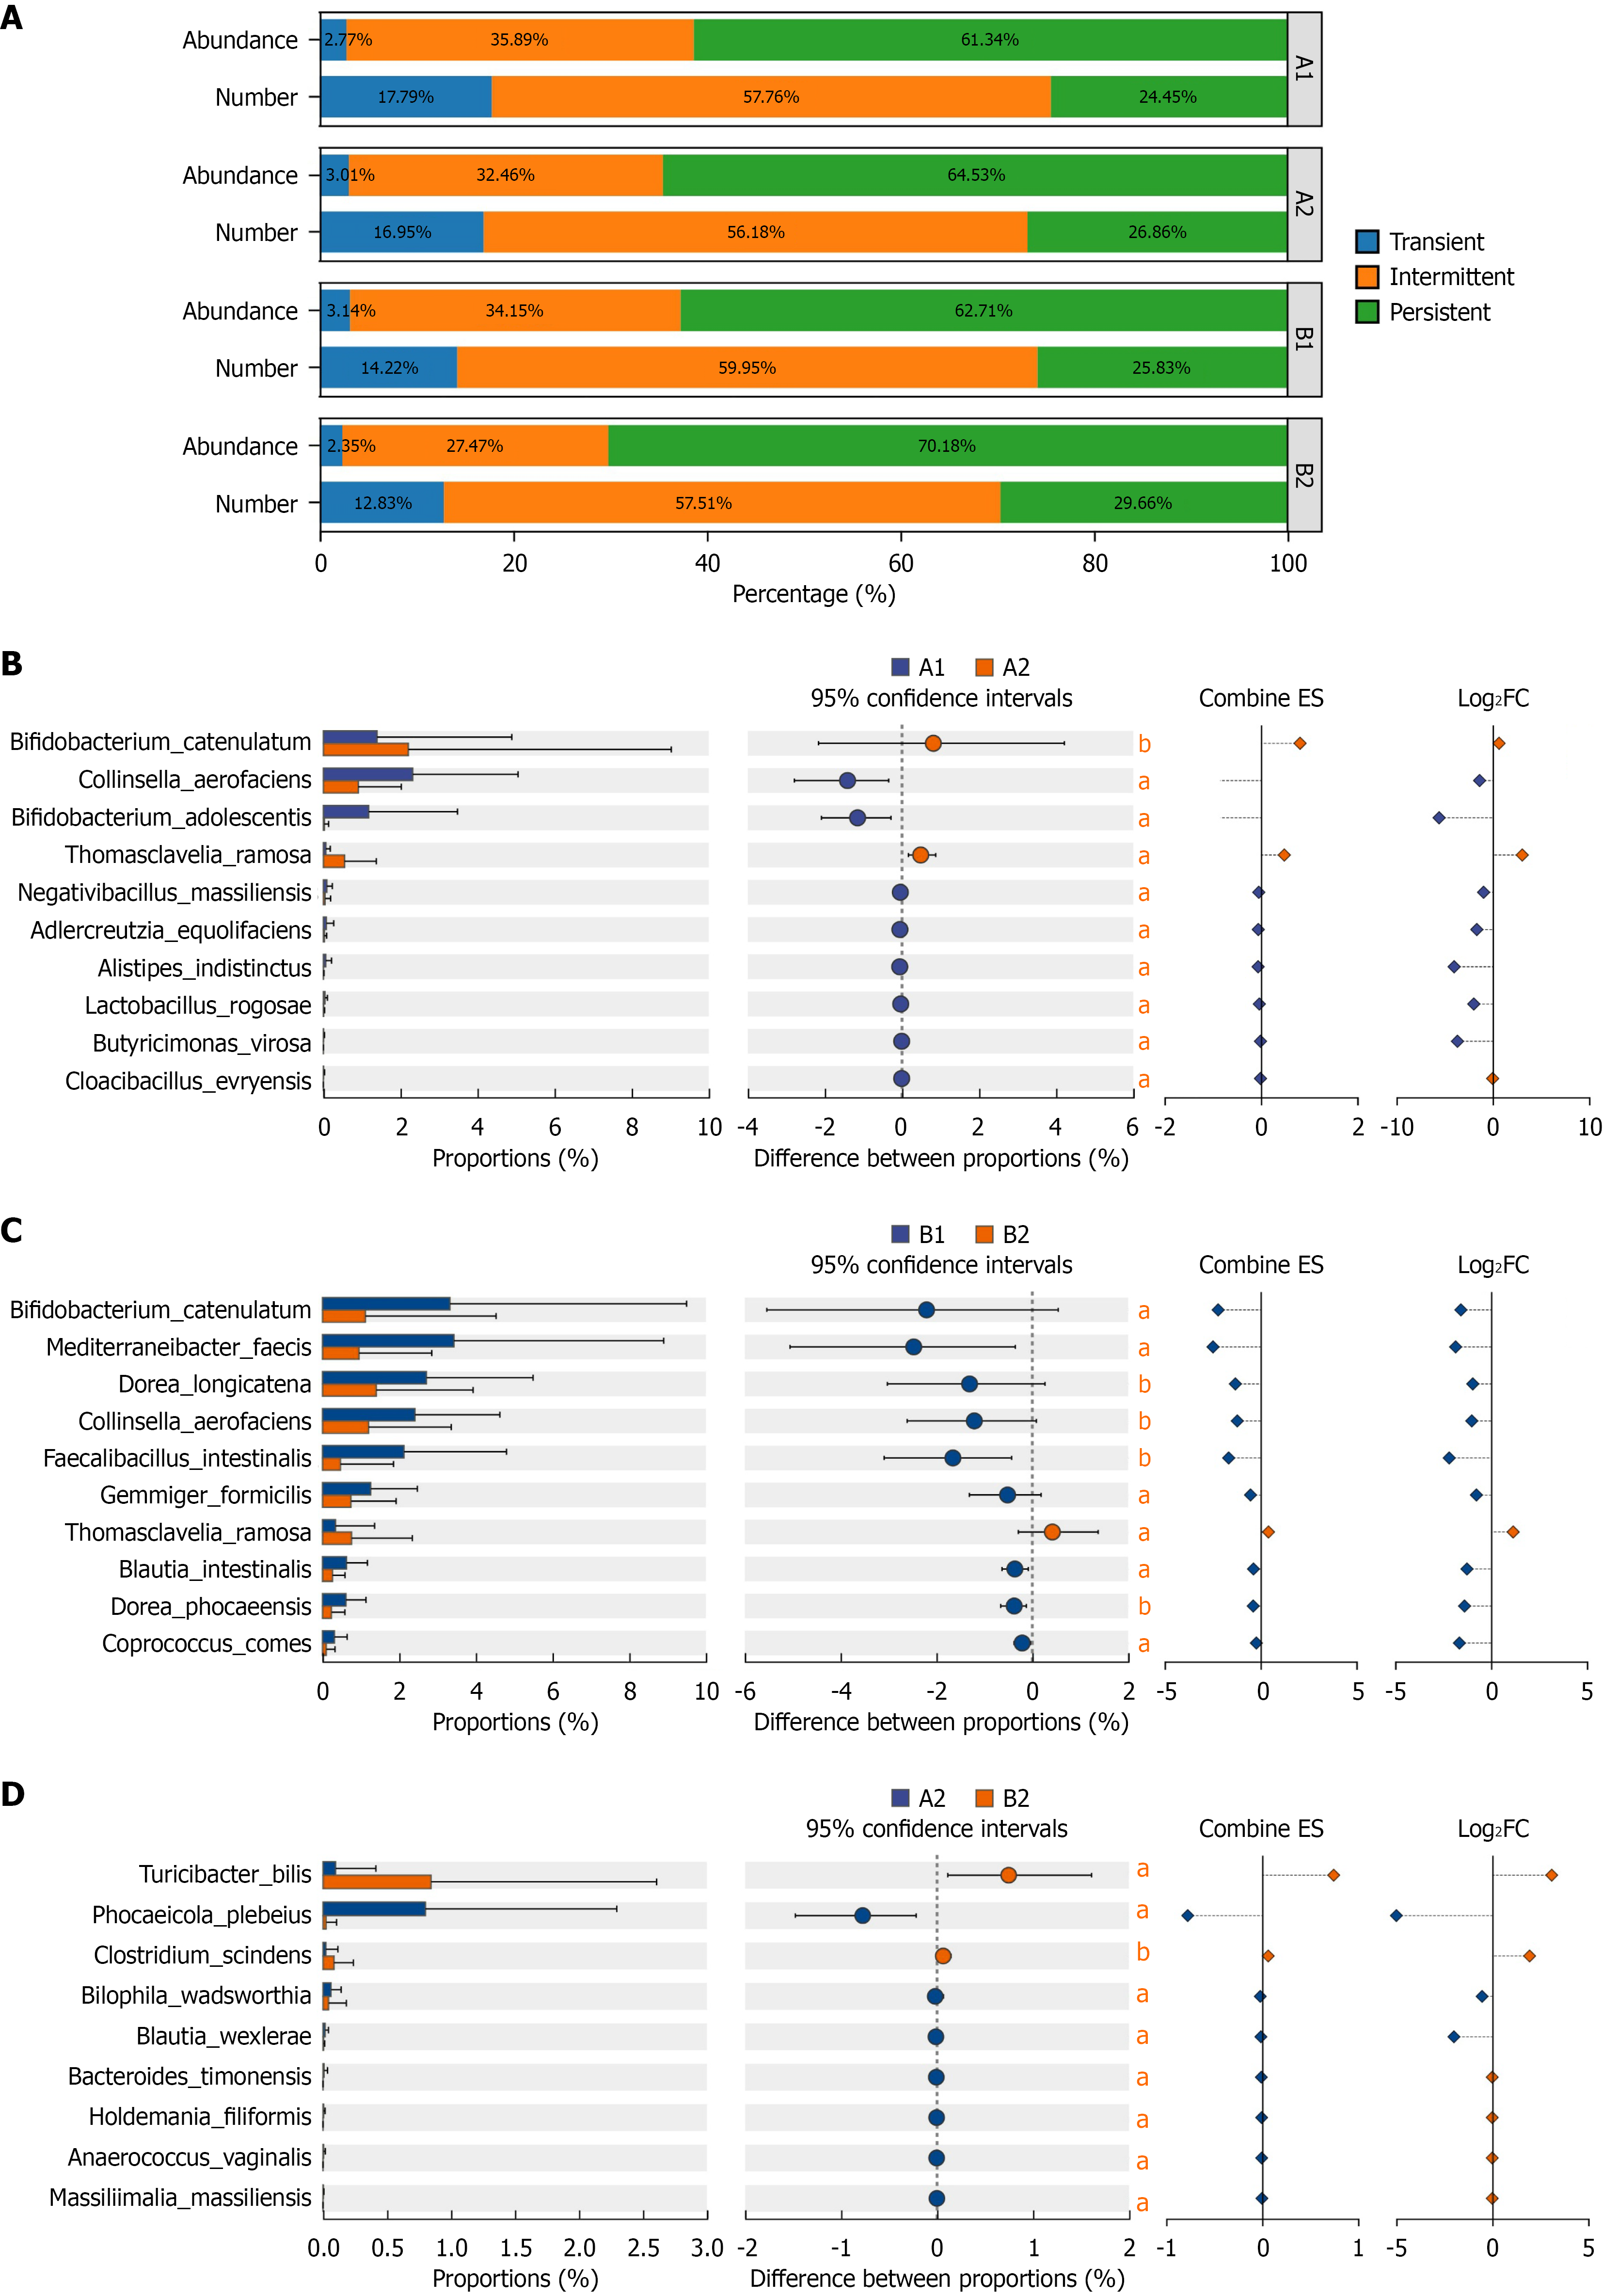
Figure 4 Species typing based on detection rate and differential species analysis of intestinal microbiota.
A: Microorganisms are classified according to environmental sensitivity and categorized into transient, intermediate, and persistent taxa based on their prevalence. This figure shows the proportion of average relative abundance and the proportion of detected number of transient, intermediate, and persistent species in the samples. The X-axis/Y-axis represents percentage, corresponding to average relative abundance or detected number; B-D: The differences in the average relative abundance of the same species among different groups, with annotations indicating the significance of differences, directly presenting the variation in average relative abundance of the same species across groups. The X-axis represents the species names at different taxonomic levels; the Y-axis represents the percentage value of the abundance of a given species in the sample; different colors represent different groups. The P value is shown on the far right. 0.01 < aP < 0.05. bP ≤ 0.01. Group A (berberine group): A1, before treatment; A2, after treatment. Group B (clarithromycin group): B1, before treatment; B2, after treatment. ES: Effect size; FC: Fold change.
- Citation: Cai TW, Chen ZK, Lv ZY, Jiang WJ, Sun YY, Jin LX, Xia CM, Li QQ, Chen X. Effects of berberine-containing vs clarithromycin-containing quadruple therapy on intestinal microbiota during Helicobacter pylori eradication. World J Gastroenterol 2026; 32(43): 122243
- URL: https://www.wjgnet.com/1007-9327/full/v32/i43/122243.htm
- DOI: https://dx.doi.org/10.3748/wjg.122243