
















Copyright: ©Author(s) 2026.
World J Gastroenterol. Nov 21, 2026; 32(43): 122243
Published online Nov 21, 2026. doi: 10.3748/wjg.122243
Published online Nov 21, 2026. doi: 10.3748/wjg.122243
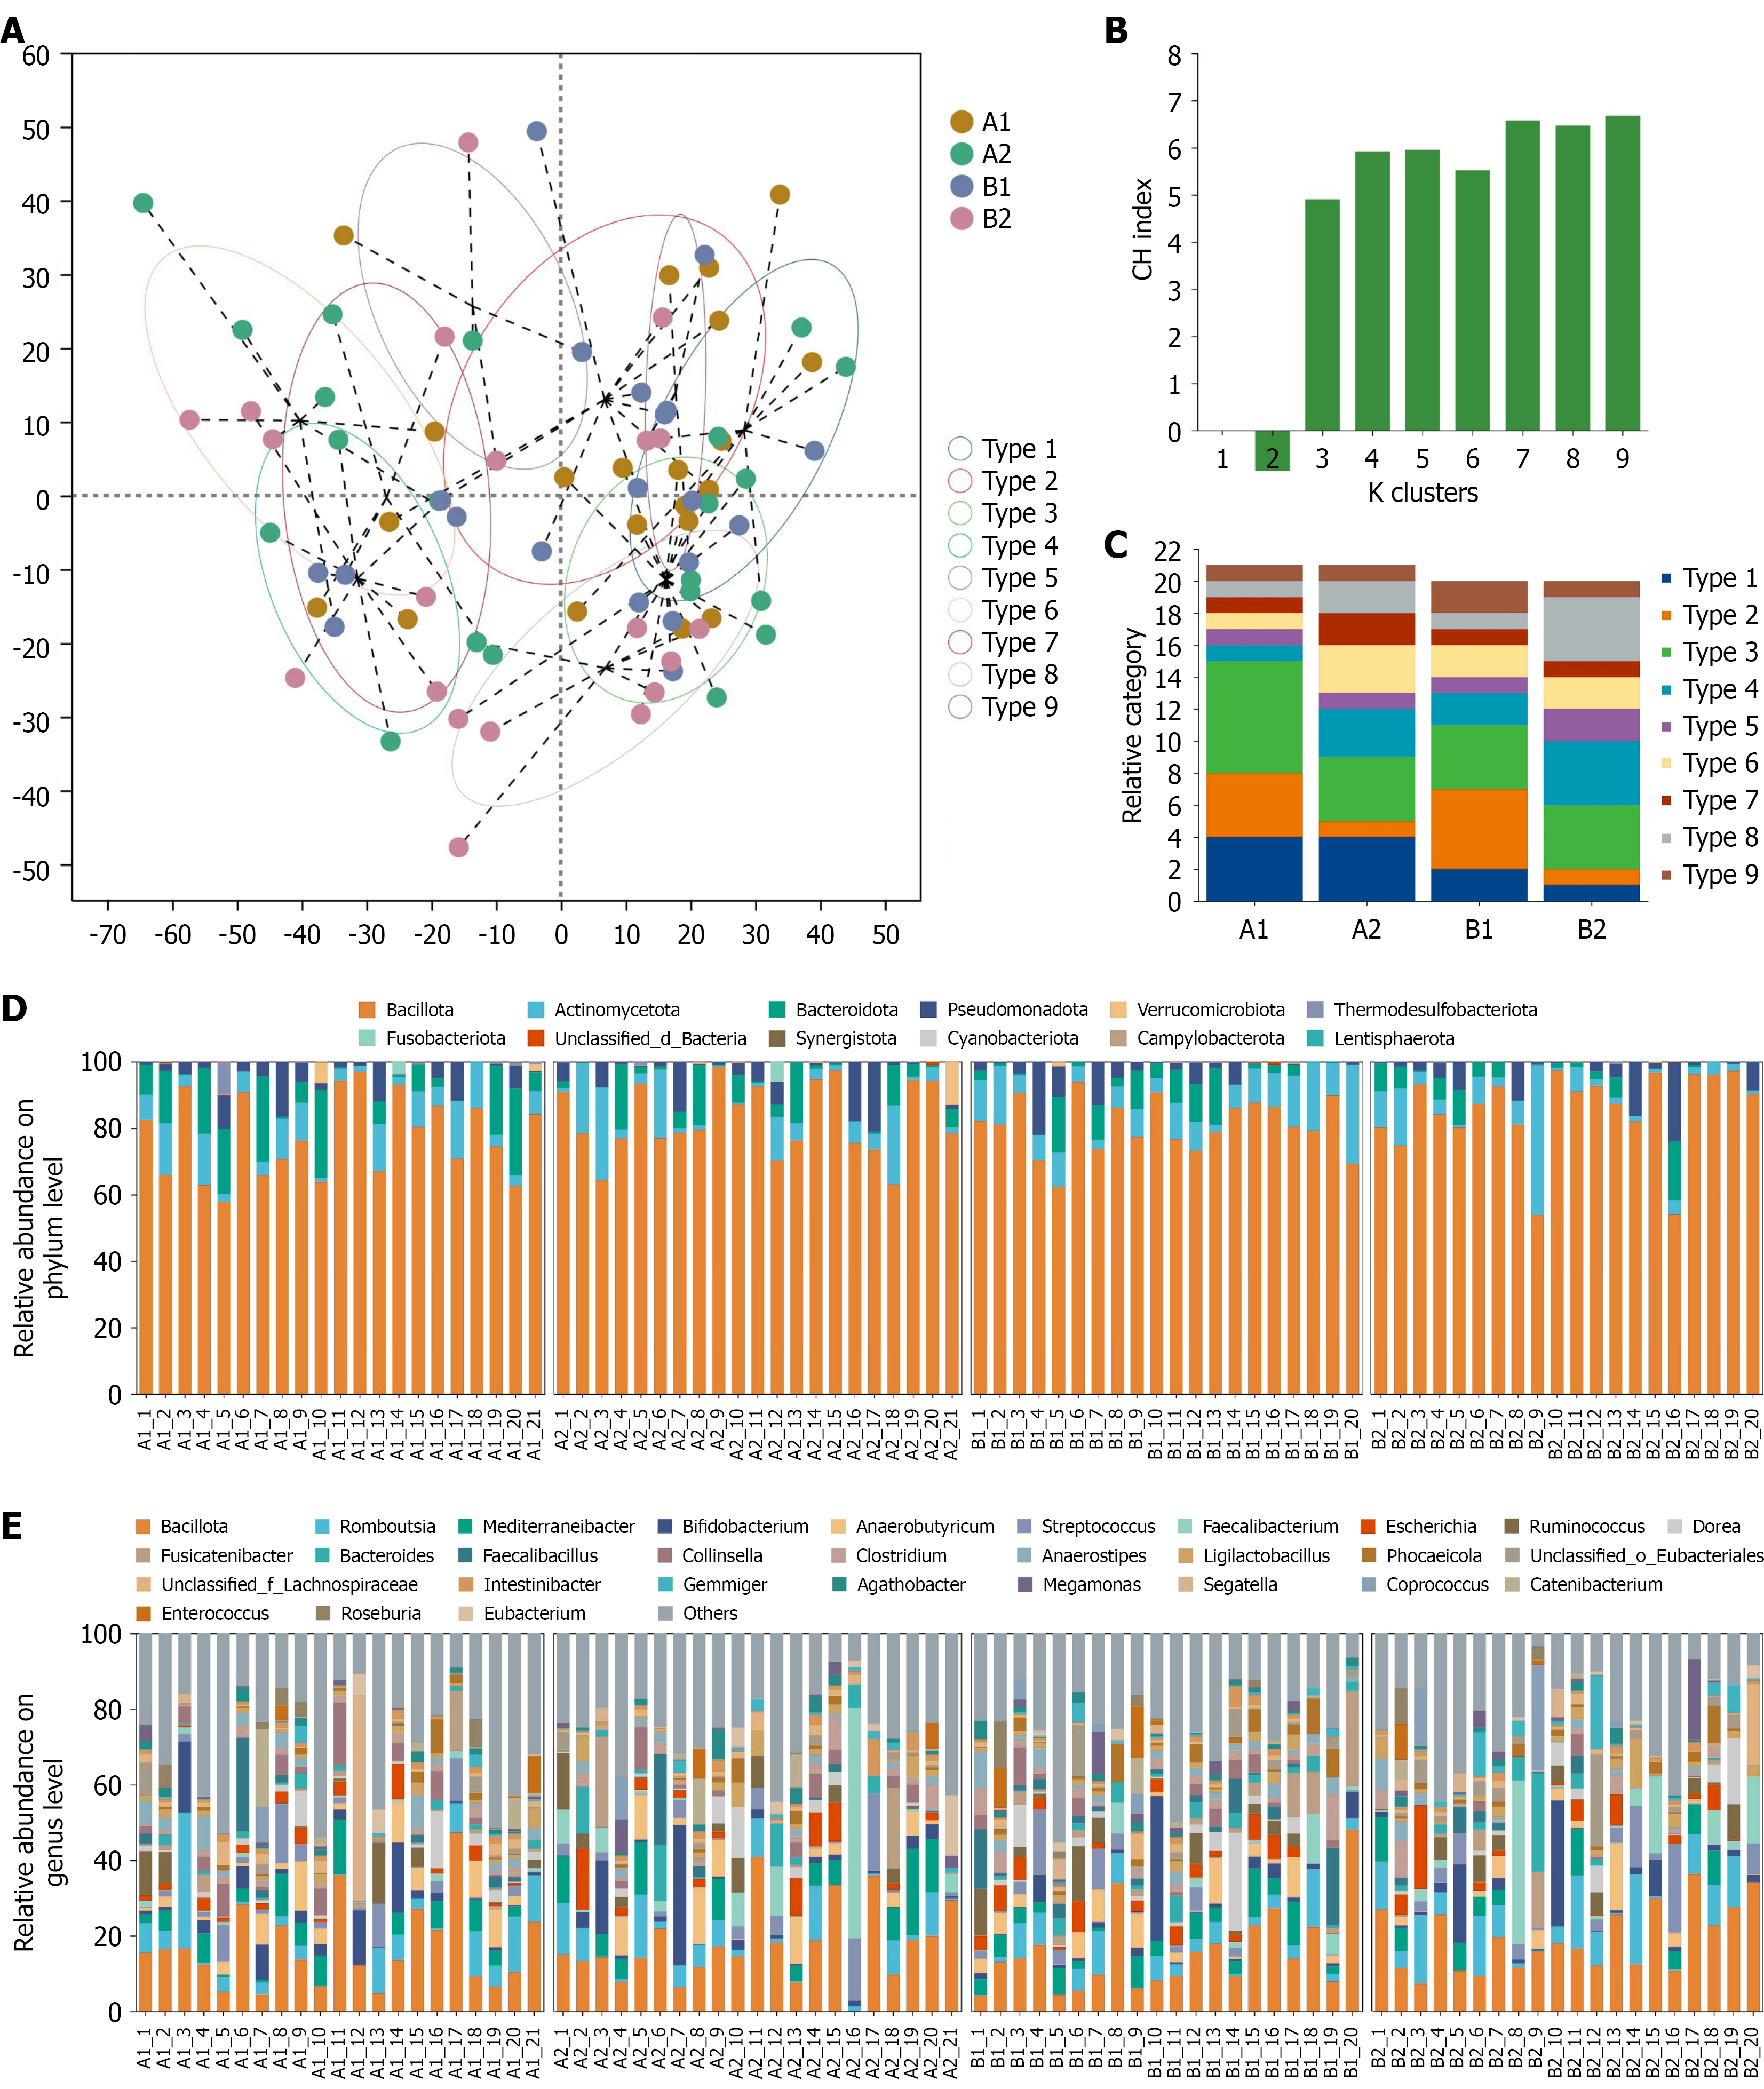
Figure 3 Composition and enterotype analysis of intestinal microbiota based on Jensen-Shannon divergence.
A: Enterotype distribution in each group. Enterotype of specific clinical samples is reflected by the structure of the dominant flora in each sample. The top right corner indicates the sample groups; different colors represent different types; the circles represent the range within the confidence interval; B: Optimal cluster number for enterotype classification selected by Calinski-Harabasz (CH) index values. The X-axis represents the number of clusters (k value), and the Y-axis denotes the magnitude of the CH index; C: Relative abundances of signature genera for each enterotype. The percentage bar chart shows the proportion of different types in each group of samples. The bar plot presents the typing composition of samples in each group, with different colors representing different types; D and E: Microbial composition at the phylum level and genus level. This figure shows the composition and proportion of the top abundant phylum/genus in all samples, with other low-abundance phylum/genus classified as others. It mainly illustrates the changes in dominant species composition across different samples/groups. The X-axis/Y-axis represents sample names, and the Y-axis/X-axis represents the relative proportion of each species in the sample. Bars of different colors represent different species, and the length of the bar indicates the relative proportion of the species. Group A (berberine group): A1, before treatment; A2, after treatment. Group B (clarithromycin group): B1, before treatment; B2, after treatment. CH: Calinski-Harabasz; BBR: Berberine; CLA: Clarithromycin.
- Citation: Cai TW, Chen ZK, Lv ZY, Jiang WJ, Sun YY, Jin LX, Xia CM, Li QQ, Chen X. Effects of berberine-containing vs clarithromycin-containing quadruple therapy on intestinal microbiota during Helicobacter pylori eradication. World J Gastroenterol 2026; 32(43): 122243
- URL: https://www.wjgnet.com/1007-9327/full/v32/i43/122243.htm
- DOI: https://dx.doi.org/10.3748/wjg.122243