
















Copyright: ©Author(s) 2026.
World J Gastroenterol. Nov 21, 2026; 32(43): 122243
Published online Nov 21, 2026. doi: 10.3748/wjg.122243
Published online Nov 21, 2026. doi: 10.3748/wjg.122243
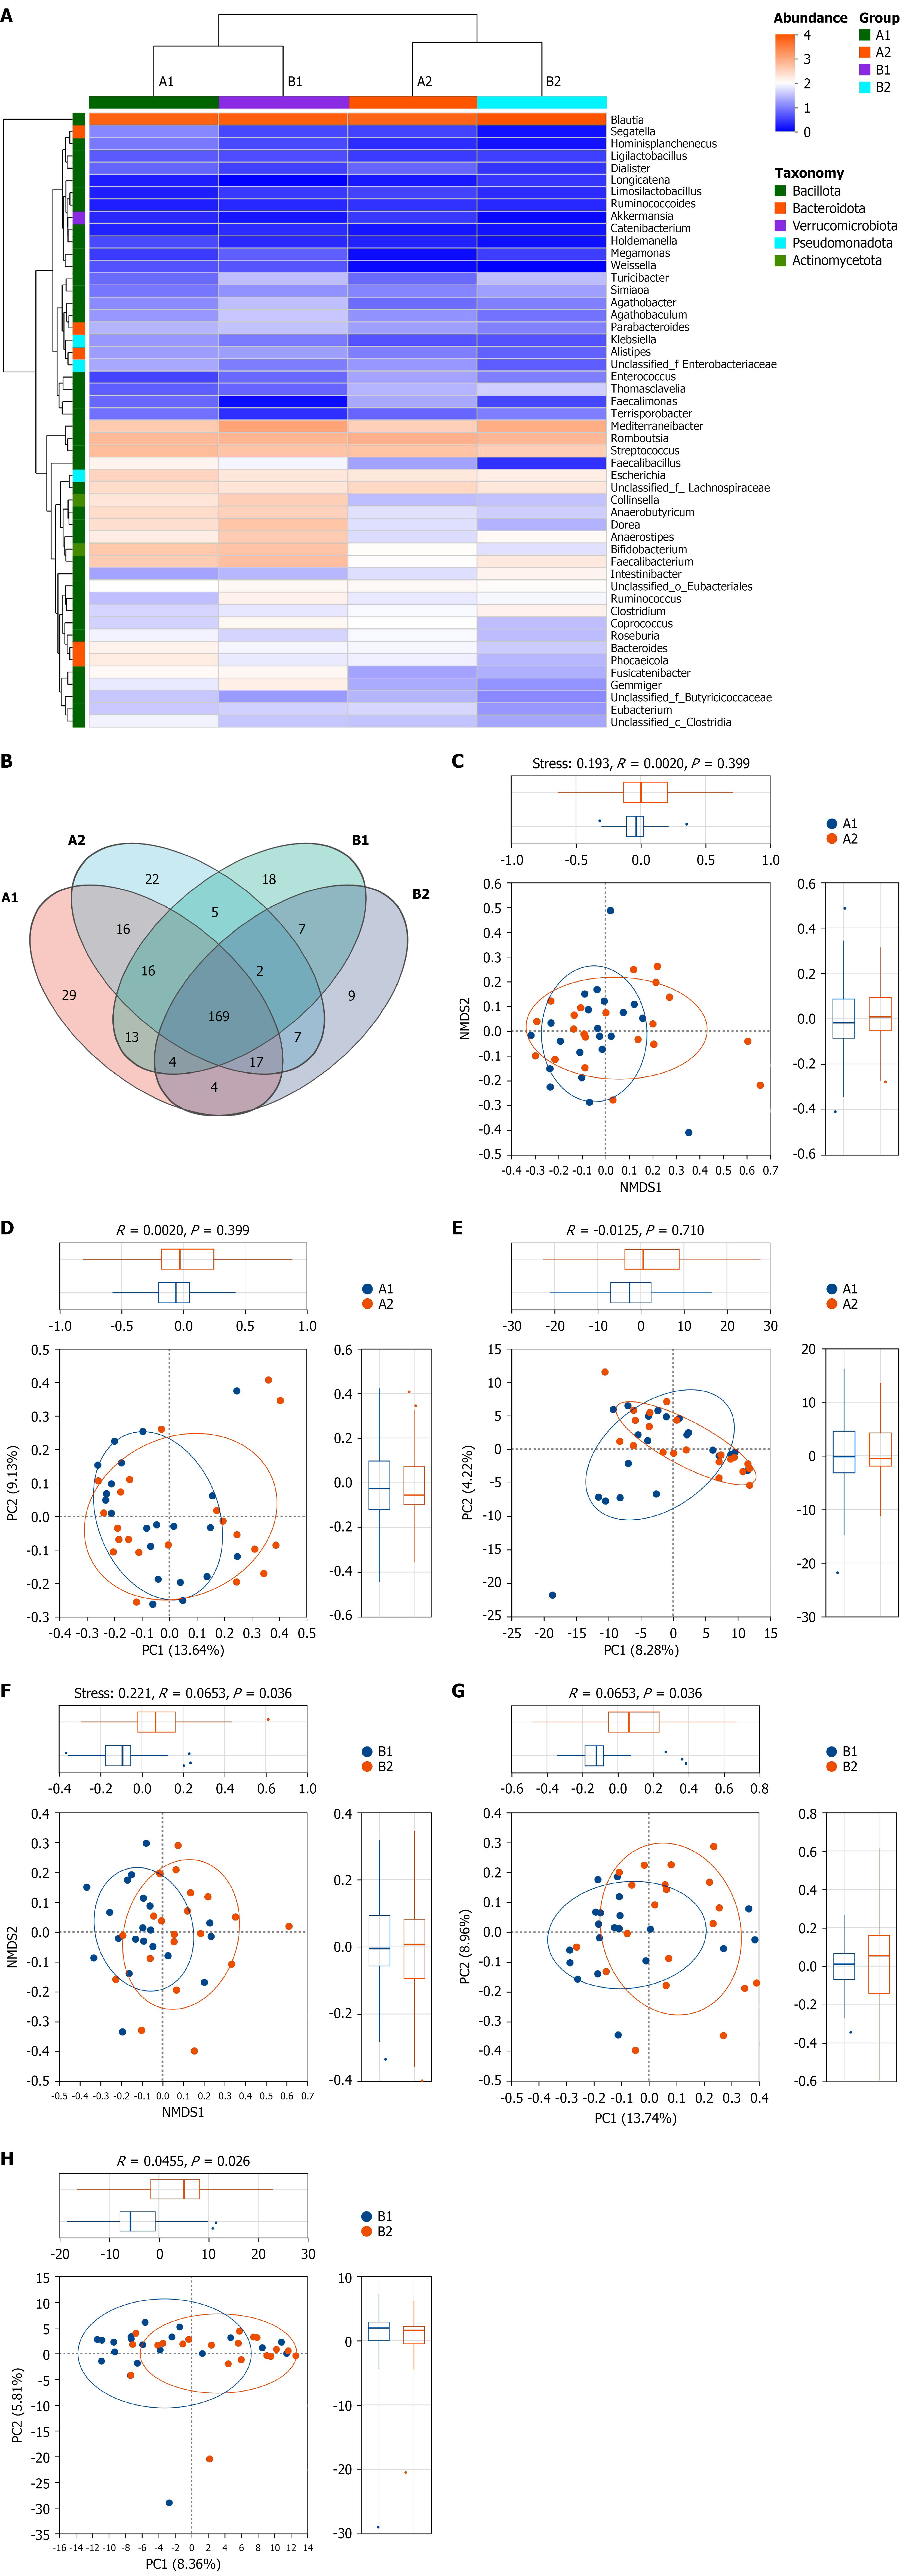
Figure 2 Beta diversity analysis of intestinal microbiota in berberine group and clarithromycin group before and after treatment.
A: Heatmap of microbial community composition at the genus level. The X-axis represents sample names, and the Y-axis represents species names. A color gradient is used to indicate the relative proportion of each species, with the corresponding values shown on the right side of the figure; B: Venn map at the genus level. Different colors represent different groups. The overlapping regions indicate species shared by multiple groups, while the non-overlapping regions represent unique species specific to that group. The numbers indicate the corresponding number of species; C-E: Non-metric multidimensional scaling (NMDS), principal co-ordinates analysis (PCoA), and principal components analysis (PCA) plots based on amplicon sequence variant (ASV) level of berberine group; F-H: NMDS, PCoA, and PCA plots based on ASV level of clarithromycin group. The horizontal and vertical axes represent the two selected principal coordinate components, and the percentages indicate the contribution of each principal coordinate component to the differences in sample composition. The scales of the horizontal and vertical axes are relative distances and have no actual physical meaning. Points of different colors or shapes represent samples from different groups. The closer two sample points are, the more similar their species composition. Group A (berberine group): A1, before treatment; A2, after treatment. Group B (clarithromycin group): B1, before treatment; B2, after treatment. NMDS: Non-metric multidimensional scaling; PC: Principal component.
- Citation: Cai TW, Chen ZK, Lv ZY, Jiang WJ, Sun YY, Jin LX, Xia CM, Li QQ, Chen X. Effects of berberine-containing vs clarithromycin-containing quadruple therapy on intestinal microbiota during Helicobacter pylori eradication. World J Gastroenterol 2026; 32(43): 122243
- URL: https://www.wjgnet.com/1007-9327/full/v32/i43/122243.htm
- DOI: https://dx.doi.org/10.3748/wjg.122243