
















Copyright: ©Author(s) 2026.
World J Gastroenterol. Nov 21, 2026; 32(43): 122243
Published online Nov 21, 2026. doi: 10.3748/wjg.122243
Published online Nov 21, 2026. doi: 10.3748/wjg.122243
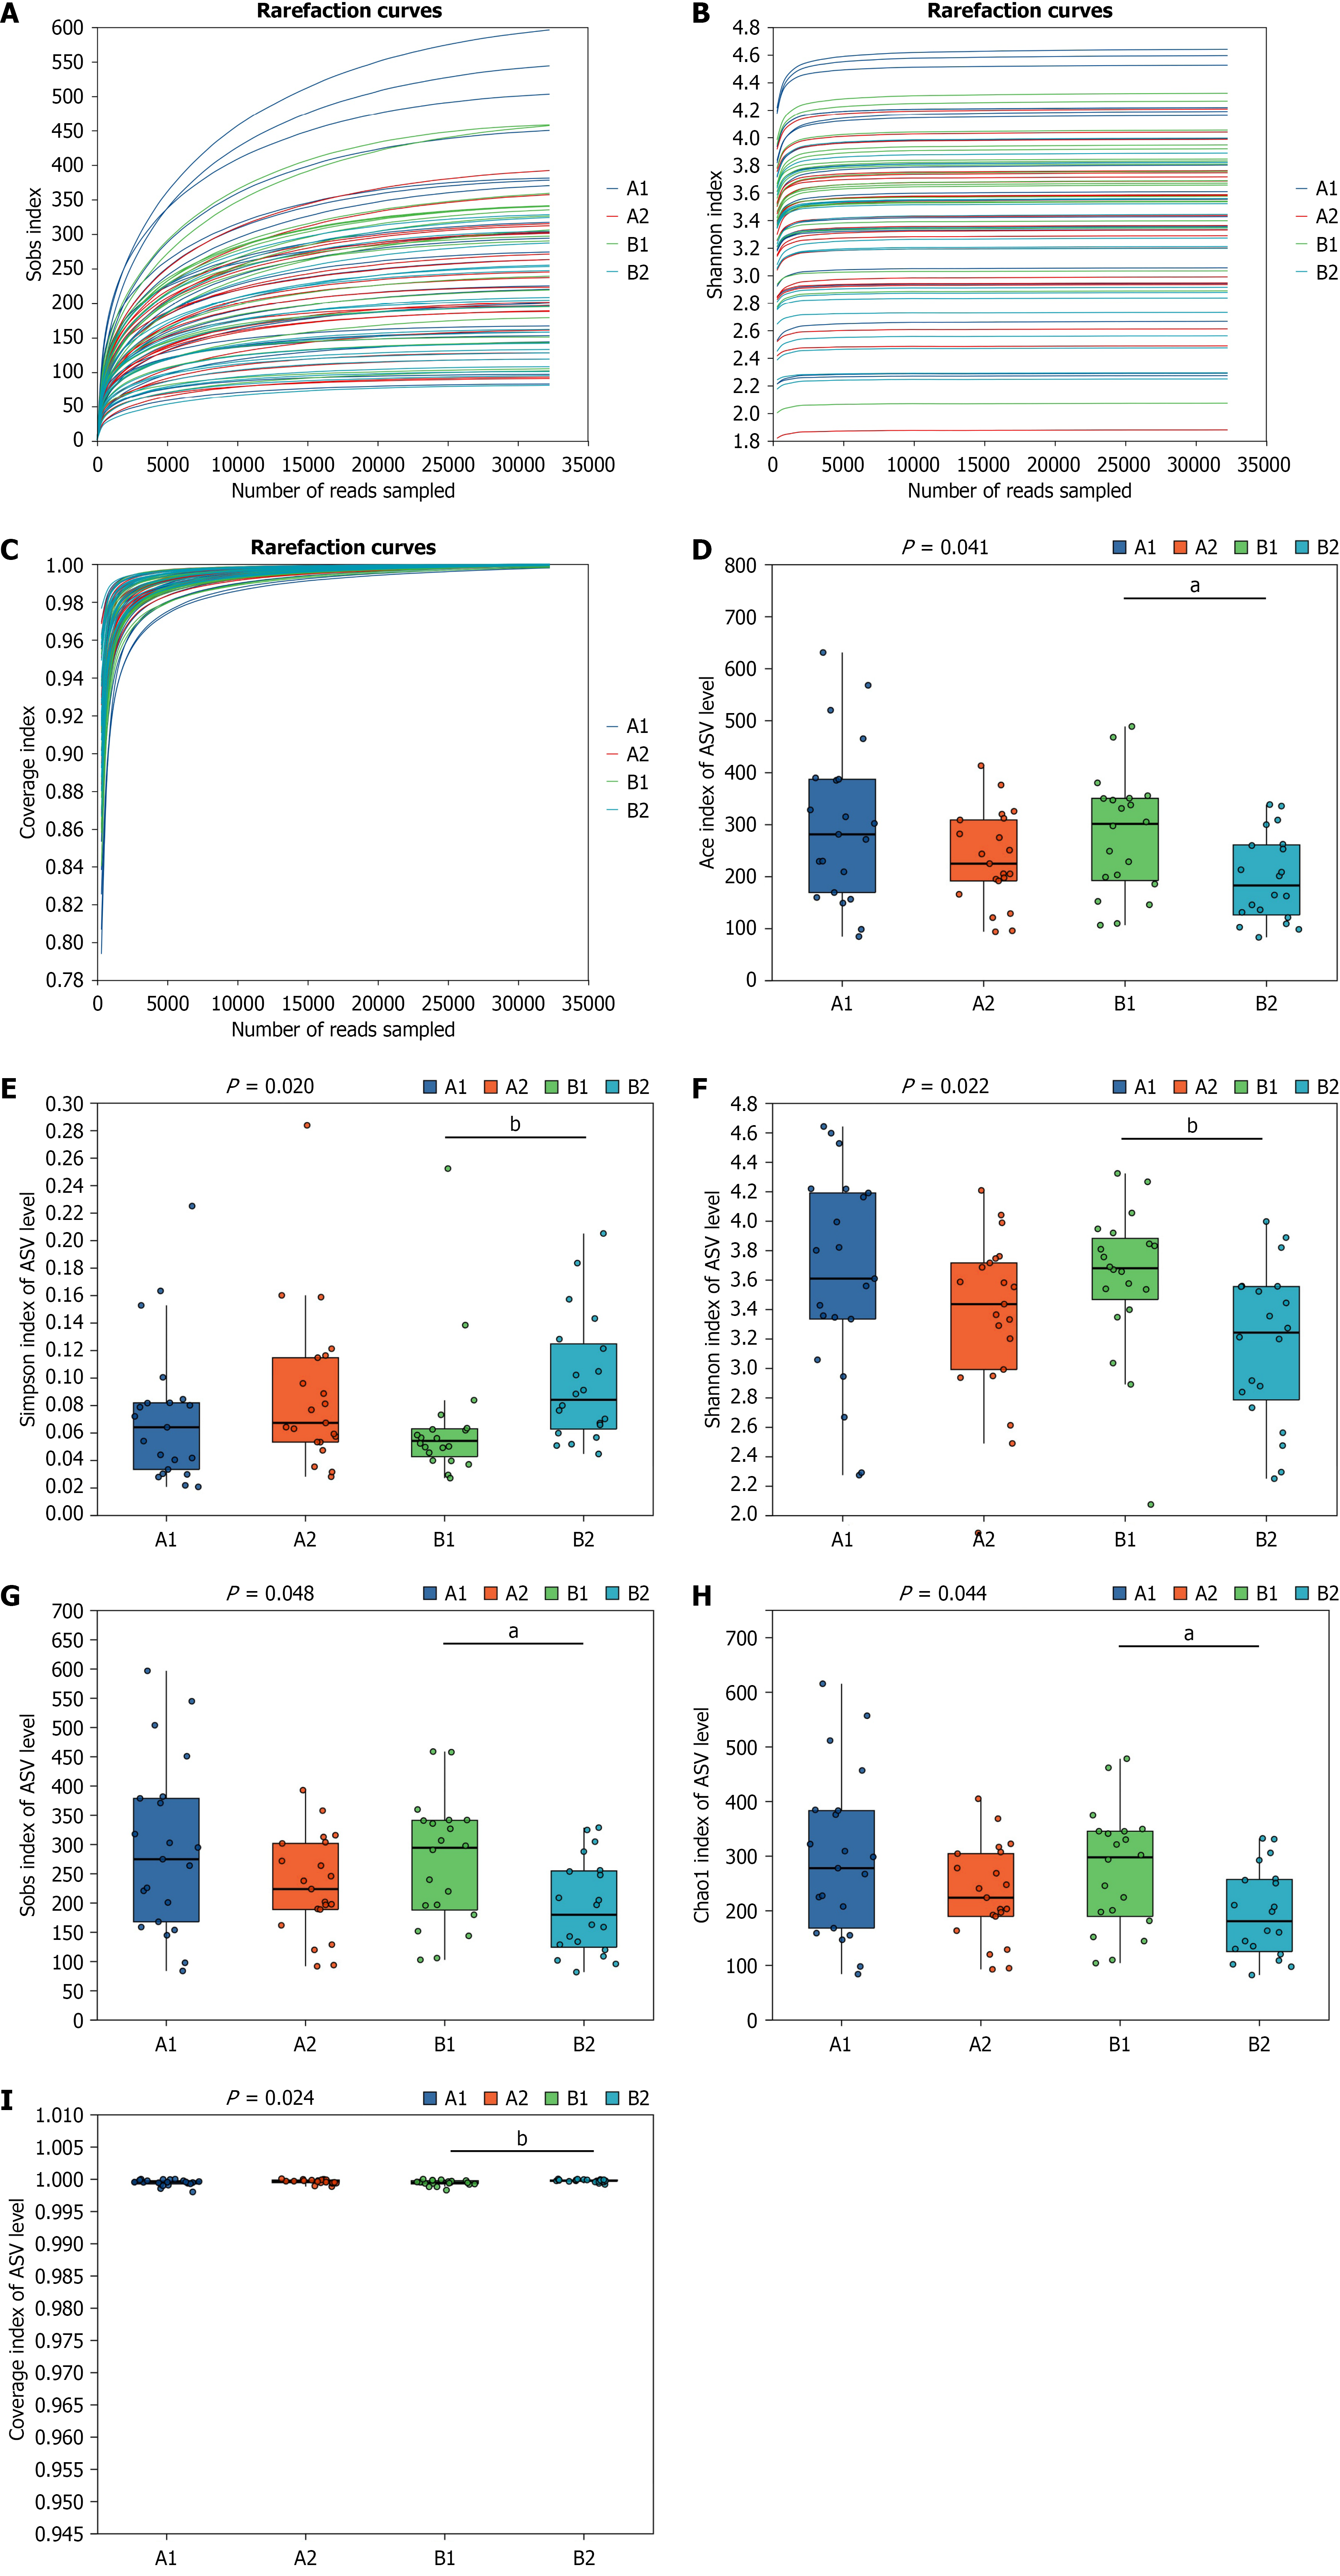
Figure 1 Rarefaction curves and comparison of alpha diversity indices of intestinal microbiota.
A: Rarefaction curves based on observed species (Sobs), X-axis: Randomly sampled sequencing data volume. Y-axis: Observed species number or diversity index; B: Rarefaction curves based on Shannon index, X-axis: Randomly sampled sequencing data volume. Y-axis: Observed species number or diversity index; C: Coverage index curves, X-axis: Randomly sampled sequencing data volume. Y-axis: Observed species number or diversity index; D-I: Comparisons of alpha diversity indices including ACE, Simpson, Shannon, Sobs, Chao1, and coverage among groups. Groups with significant differences are labeled as follows: 0.01 < aP < 0.05. bP ≤ 0.01. The X-axis represents group names, and the Y-axis represents the index value of each group. Group A (berberine group): A1, before treatment; A2, after treatment. Group B (clarithromycin group): B1, before treatment; B2, after treatment. ASV: Amplicon sequence variant.
- Citation: Cai TW, Chen ZK, Lv ZY, Jiang WJ, Sun YY, Jin LX, Xia CM, Li QQ, Chen X. Effects of berberine-containing vs clarithromycin-containing quadruple therapy on intestinal microbiota during Helicobacter pylori eradication. World J Gastroenterol 2026; 32(43): 122243
- URL: https://www.wjgnet.com/1007-9327/full/v32/i43/122243.htm
- DOI: https://dx.doi.org/10.3748/wjg.122243