
















Copyright: ©Author(s) 2026.
World J Gastroenterol. Nov 14, 2026; 32(42): 121690
Published online Nov 14, 2026. doi: 10.3748/wjg.121690
Published online Nov 14, 2026. doi: 10.3748/wjg.121690
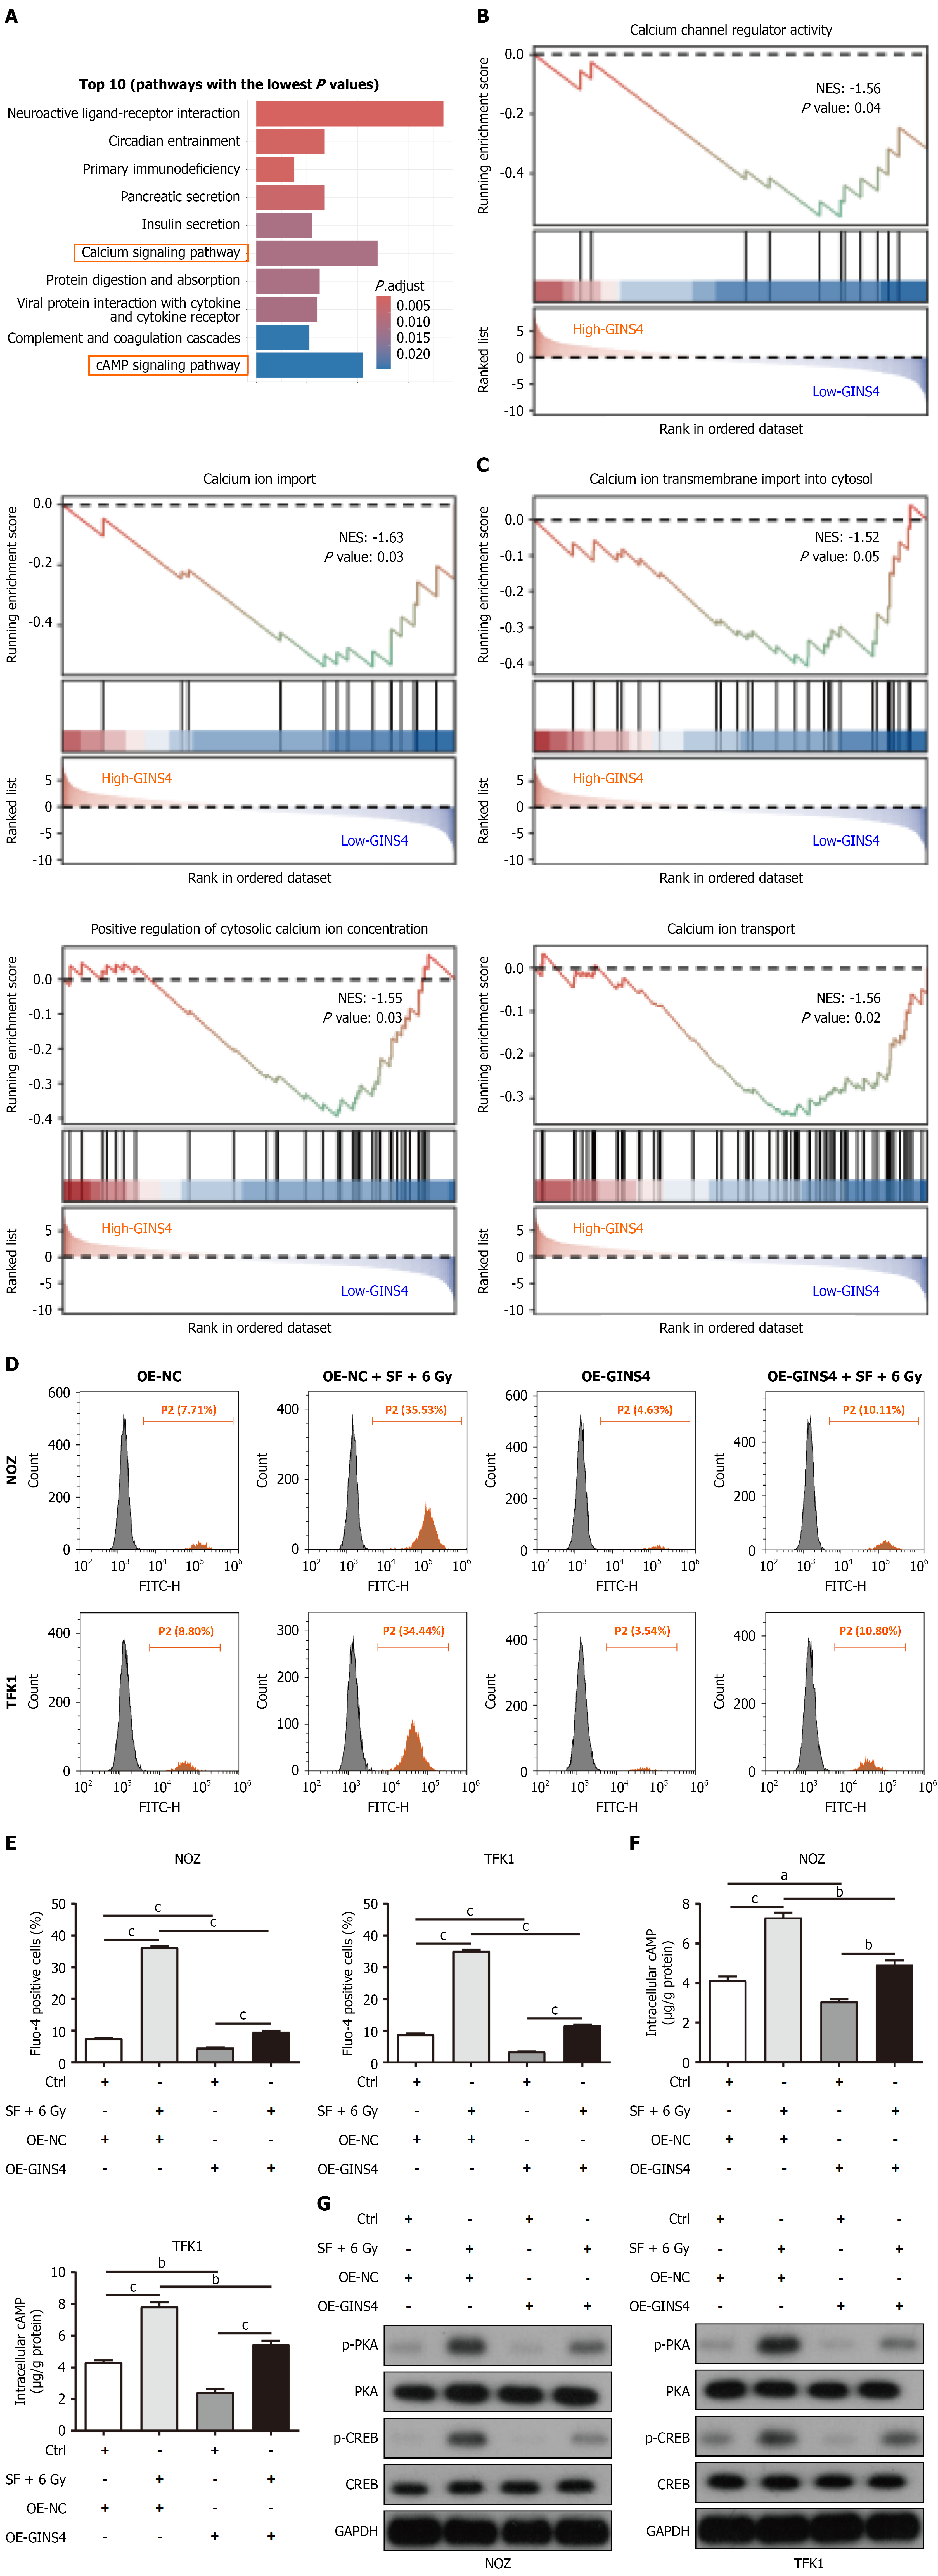
Figure 5 GINS4 expression is correlated with Ca2+/cAMP signaling in surufatinib-treated cells.
A: Kyoto Encyclopedia of Genes and Genomes pathway enrichment analysis of GINS4 reveals significant pathways; B and C: Gene Set Enrichment Analysis highlights the impact of GINS4 on calcium signaling pathways; D and E: The Fluo-4 calcium ion detection kit was employed to measure changes in intracellular calcium ion concentration across different intervention groups, and quantitative analysis was presented in a histogram; F: Enzyme-linked immunosorbent assay was utilized to quantitatively analyze cAMP levels in different treatment groups for both OE-GINS4 and control (Ctrl) samples; G: Western blot analysis was performed to assess the expression of cAMP downstream-related proteins in different treatment groups for both OE-GINS4 and Ctrl samples. All data are presented as mean ± SEM from three independent experiments. aP < 0.05, bP < 0.01, cP < 0.001. Ctrl: Control; GINS4 overexpression: OE-GINS4; SF: Surufatinib.
- Citation: Huang A, Cao Y, Li B, Xiao J, Zhan SD, Wang NY, Mei XP, Zhao SZ, Han J, Xiao Y, Wang LF, Ma H. Surufatinib achieves radiosensitivity in cholangiocarcinoma by suppressing GINS4 expression to induce Ca2+/cAMP signaling activation. World J Gastroenterol 2026; 32(42): 121690
- URL: https://www.wjgnet.com/1007-9327/full/v32/i42/121690.htm
- DOI: https://dx.doi.org/10.3748/wjg.121690