
















Copyright: ©Author(s) 2026.
World J Gastroenterol. Nov 7, 2026; 32(41): 121893
Published online Nov 7, 2026. doi: 10.3748/wjg.121893
Published online Nov 7, 2026. doi: 10.3748/wjg.121893
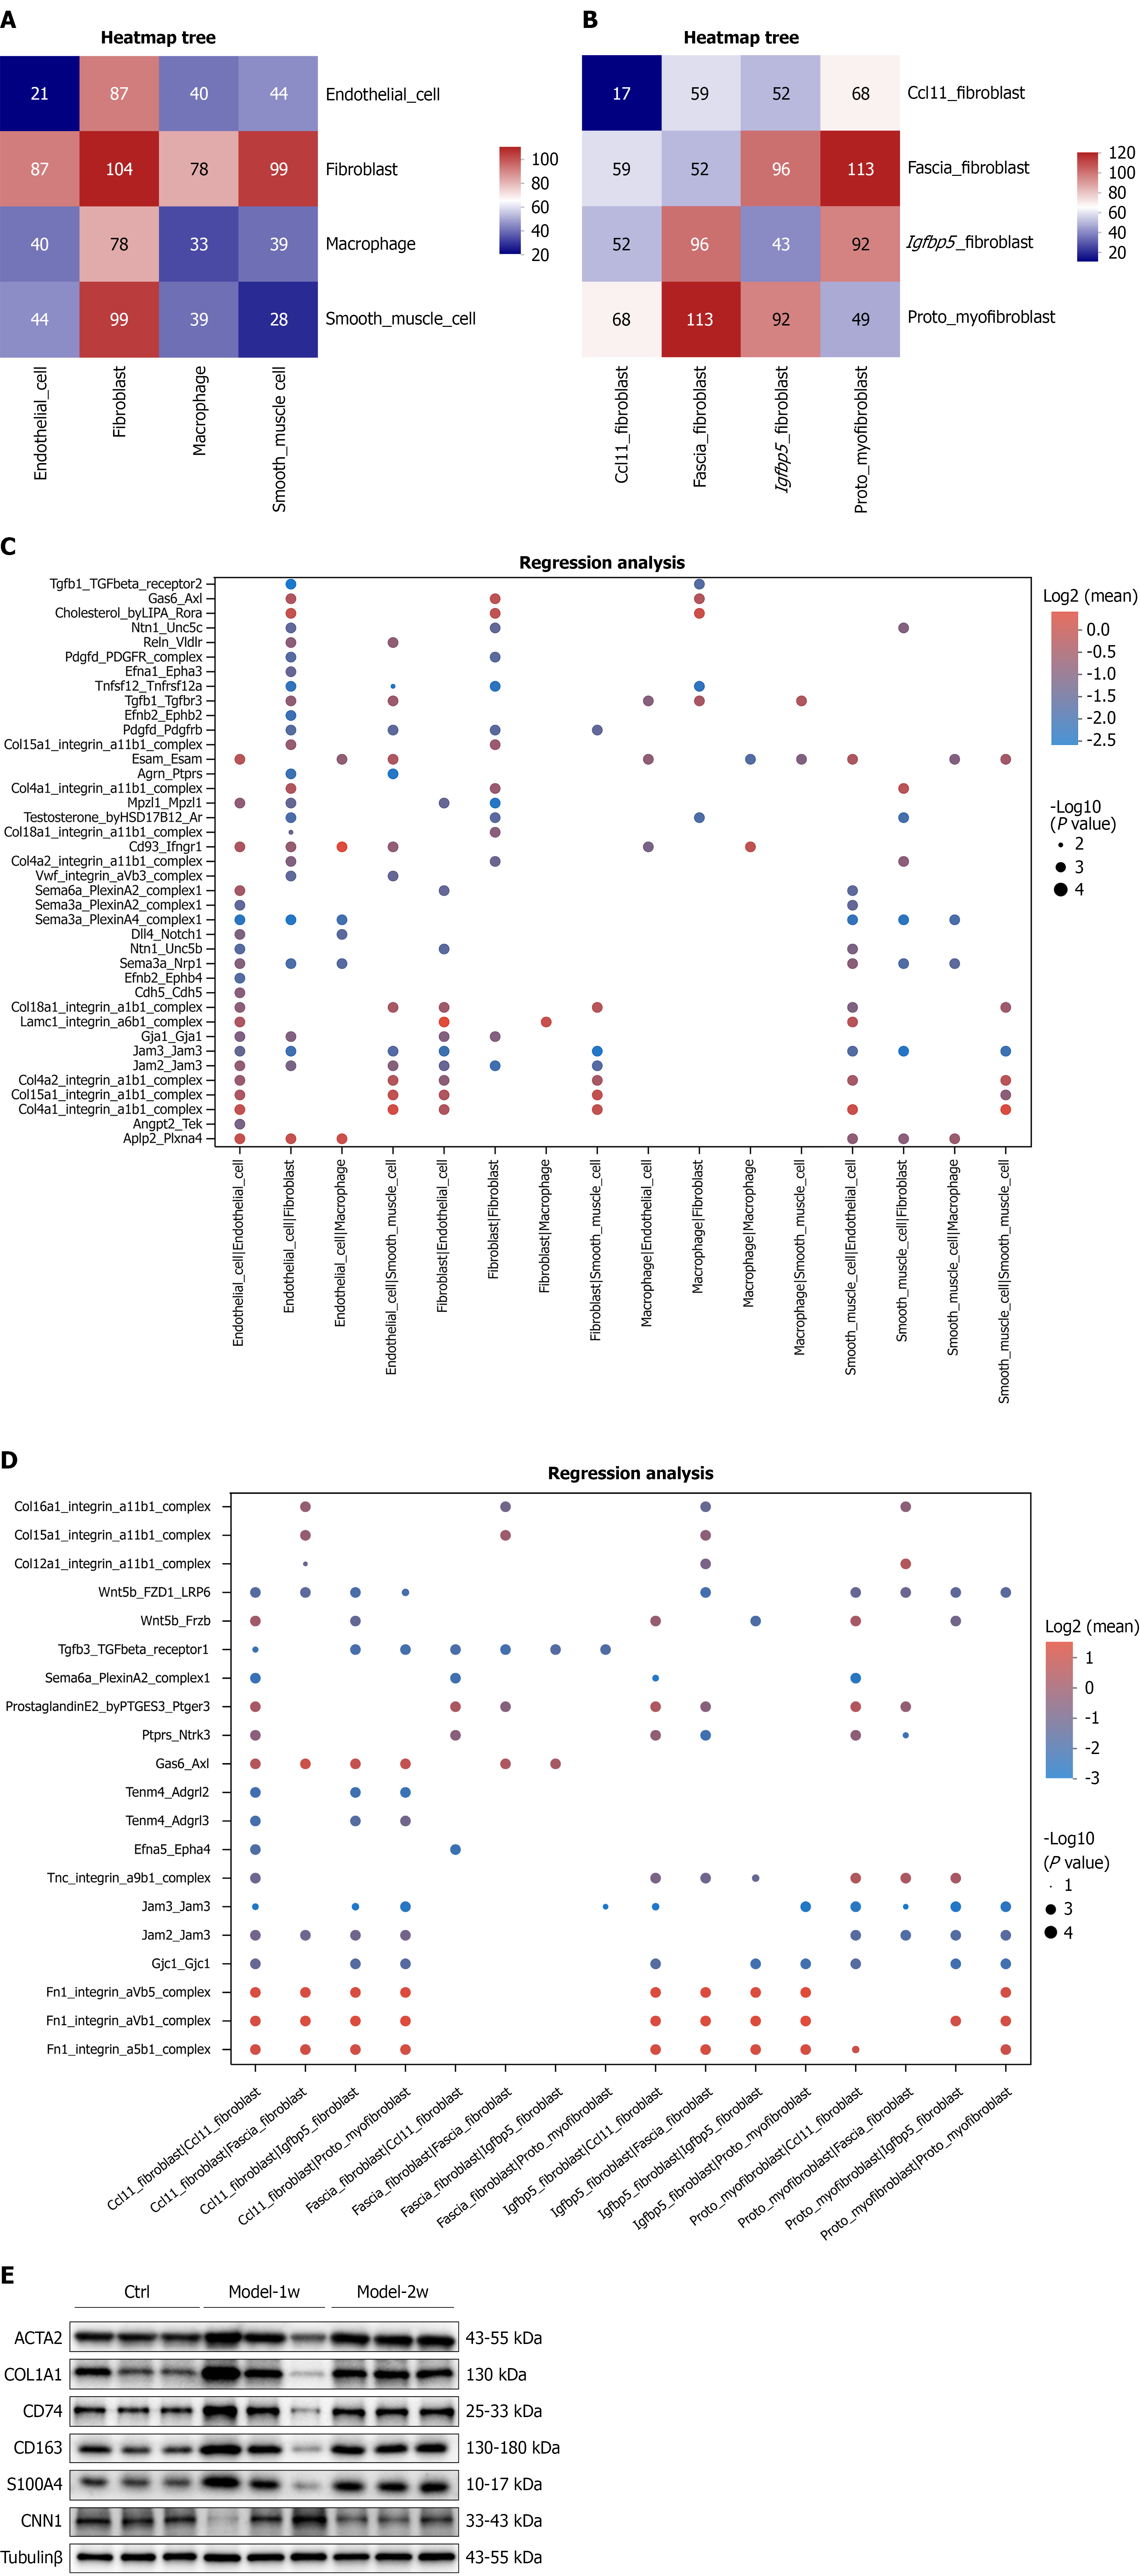
Figure 7 Intercellular communication networks and protein expression.
A and B: The X-axis and Y-axis indicate cell types; the color gradient from dark blue to dark red indicates an increasing number of interactions; C and D: The X-axis indicates cell type interactions, and the Y-axis indicates ligand-receptor pairs. Larger dots indicate smaller P values (greater significance); the color represents the average expression level (indicating interaction strength); E: Western blots showing protein expression. Ctrl: Control group; Model-1w: 1 week of modeling; Model-2w: 2 weeks of modeling.
- Citation: Lin WG, Huang SY, Lan H, Zheng XX, Liu XB, Xu ZG, Ke MH. Spatiotemporal atlas of internal hemorrhoids in rats elucidated using integrated single-cell RNA sequencing and spatial transcriptomics. World J Gastroenterol 2026; 32(41): 121893
- URL: https://www.wjgnet.com/1007-9327/full/v32/i41/121893.htm
- DOI: https://dx.doi.org/10.3748/wjg.121893