
















Copyright: ©Author(s) 2026.
World J Gastroenterol. Nov 7, 2026; 32(41): 121893
Published online Nov 7, 2026. doi: 10.3748/wjg.121893
Published online Nov 7, 2026. doi: 10.3748/wjg.121893
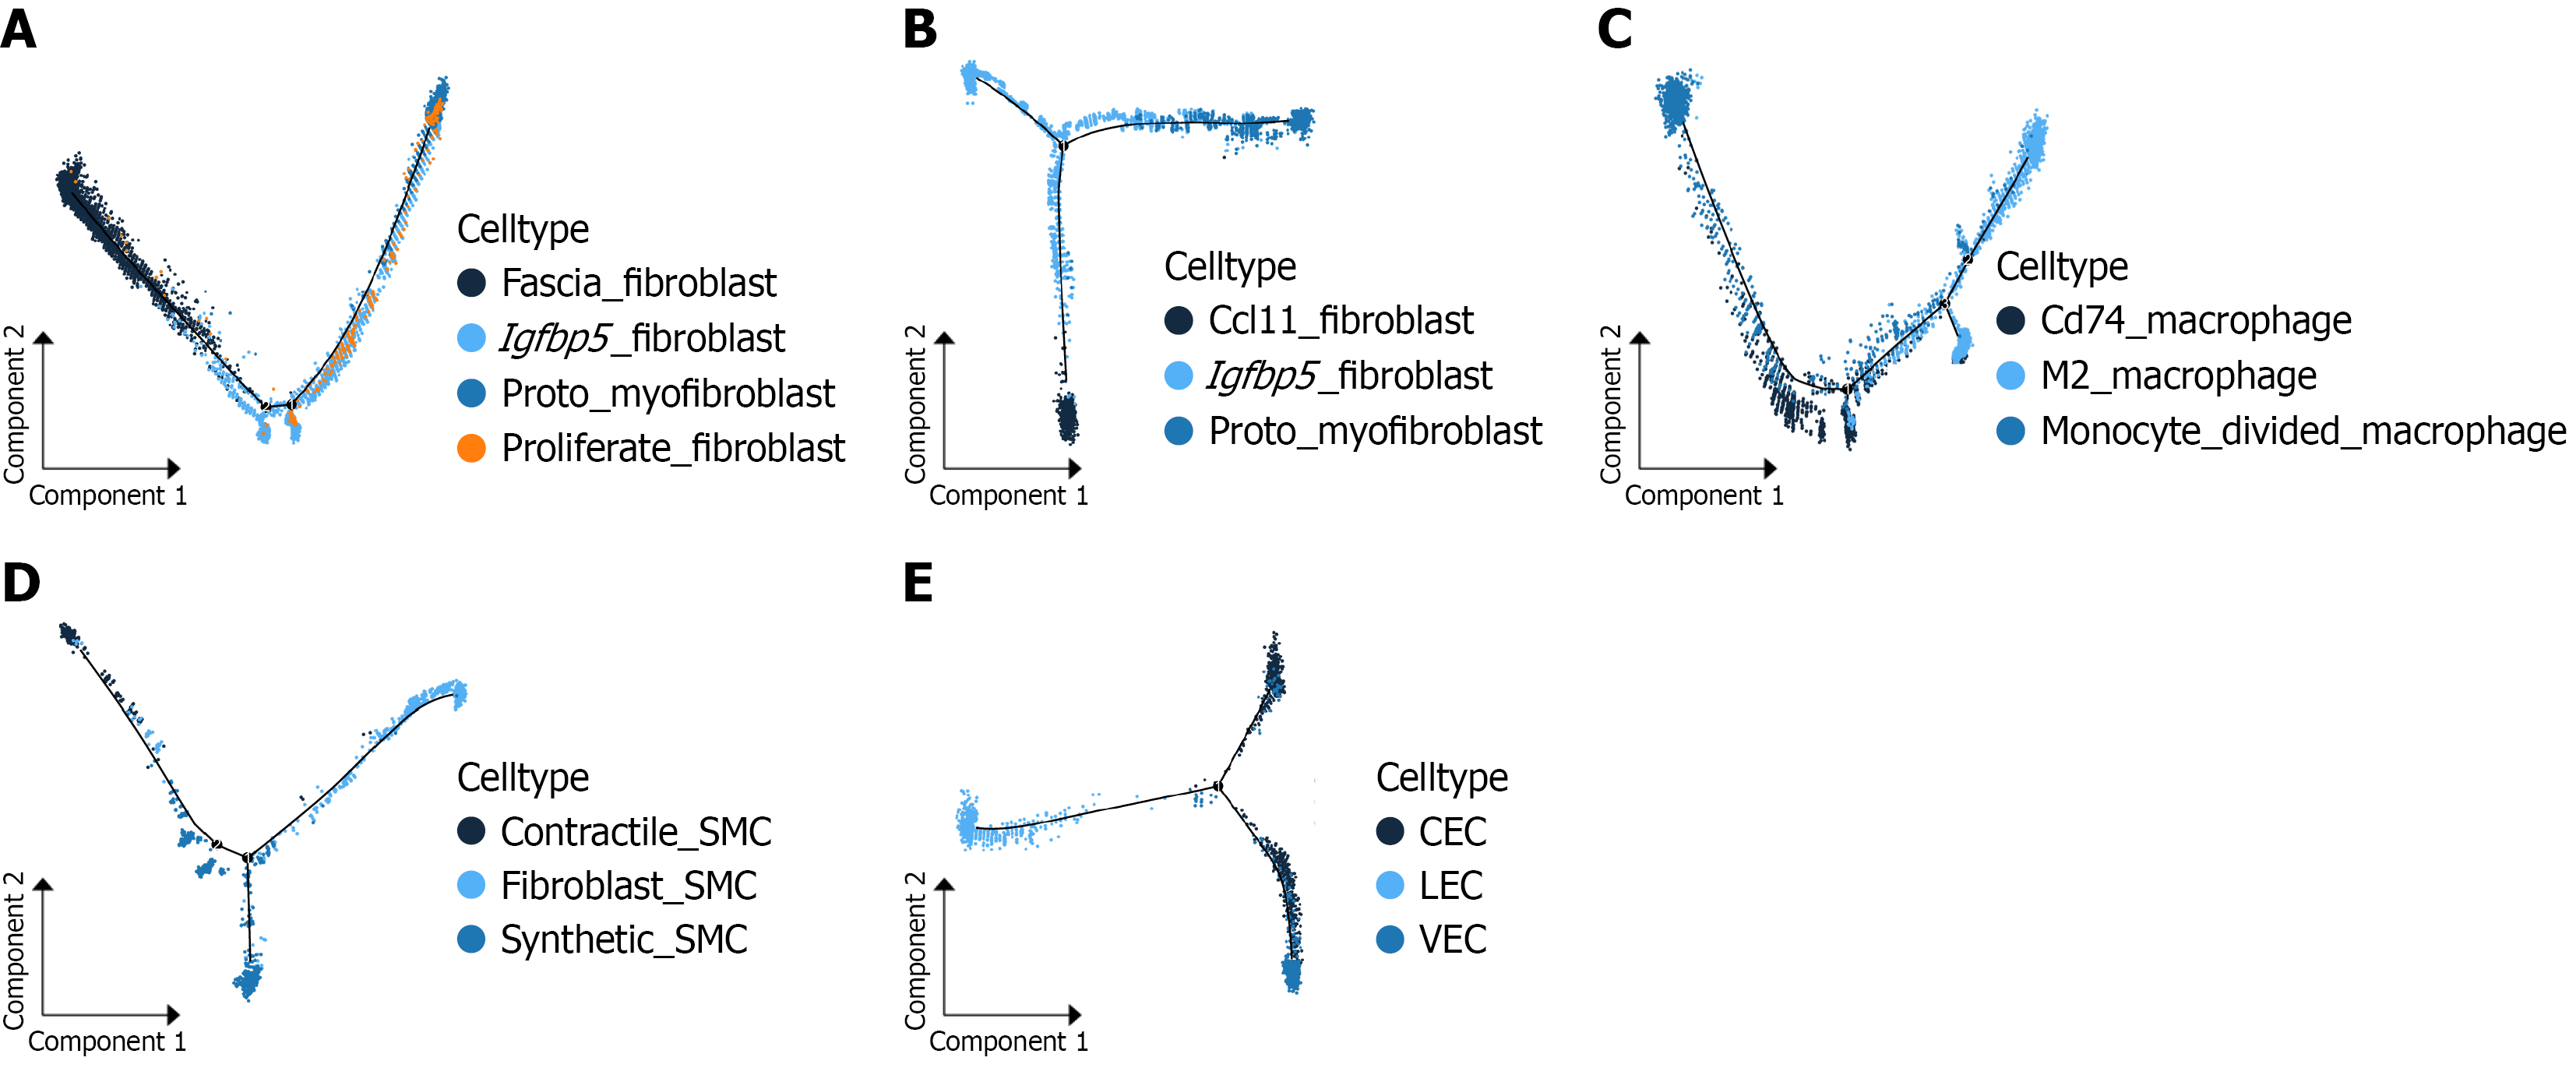
Figure 5 Pseudotime plots.
Each dot represents a cell arranged along a pseudotime trajectory. Color gradients indicate cell state transitions; numbers in black circles indicate differentiation nodes. A: Pseudotime trajectory analysis of four fibroblast subsets (fascia-fibroblast, Igfbp5-fibroblast, protomyofibroblast, and proliferate-fibroblast); B: Pseudotime trajectory analysis of three fibroblast subsets (Ccl11-fibroblast, Igfbp5-fibroblast, and protomyofibroblast); C: Pseudotime trajectory analysis of three macrophage subsets (Cd74-expressing macrophage, M2 macrophage, and monocyte-derived macrophage); D: Pseudotime trajectory analysis of three smooth muscle cell (SMC) subsets: Fibroblast-SMC, contractile-SMC, and synthetic-SMC; E: Pseudotime trajectory analysis of three endothelial cell subsets: Circulating endothelial cell, lymphatic endothelial cell, and vascular endothelial cell. SMC: Smooth muscle cell; CEC: Circulating endothelial cell; LEC: Lymphatic endothelial cell; VEC: Vascular endothelial cell.
- Citation: Lin WG, Huang SY, Lan H, Zheng XX, Liu XB, Xu ZG, Ke MH. Spatiotemporal atlas of internal hemorrhoids in rats elucidated using integrated single-cell RNA sequencing and spatial transcriptomics. World J Gastroenterol 2026; 32(41): 121893
- URL: https://www.wjgnet.com/1007-9327/full/v32/i41/121893.htm
- DOI: https://dx.doi.org/10.3748/wjg.121893