
















Copyright: ©Author(s) 2026.
World J Gastroenterol. Nov 7, 2026; 32(41): 121893
Published online Nov 7, 2026. doi: 10.3748/wjg.121893
Published online Nov 7, 2026. doi: 10.3748/wjg.121893
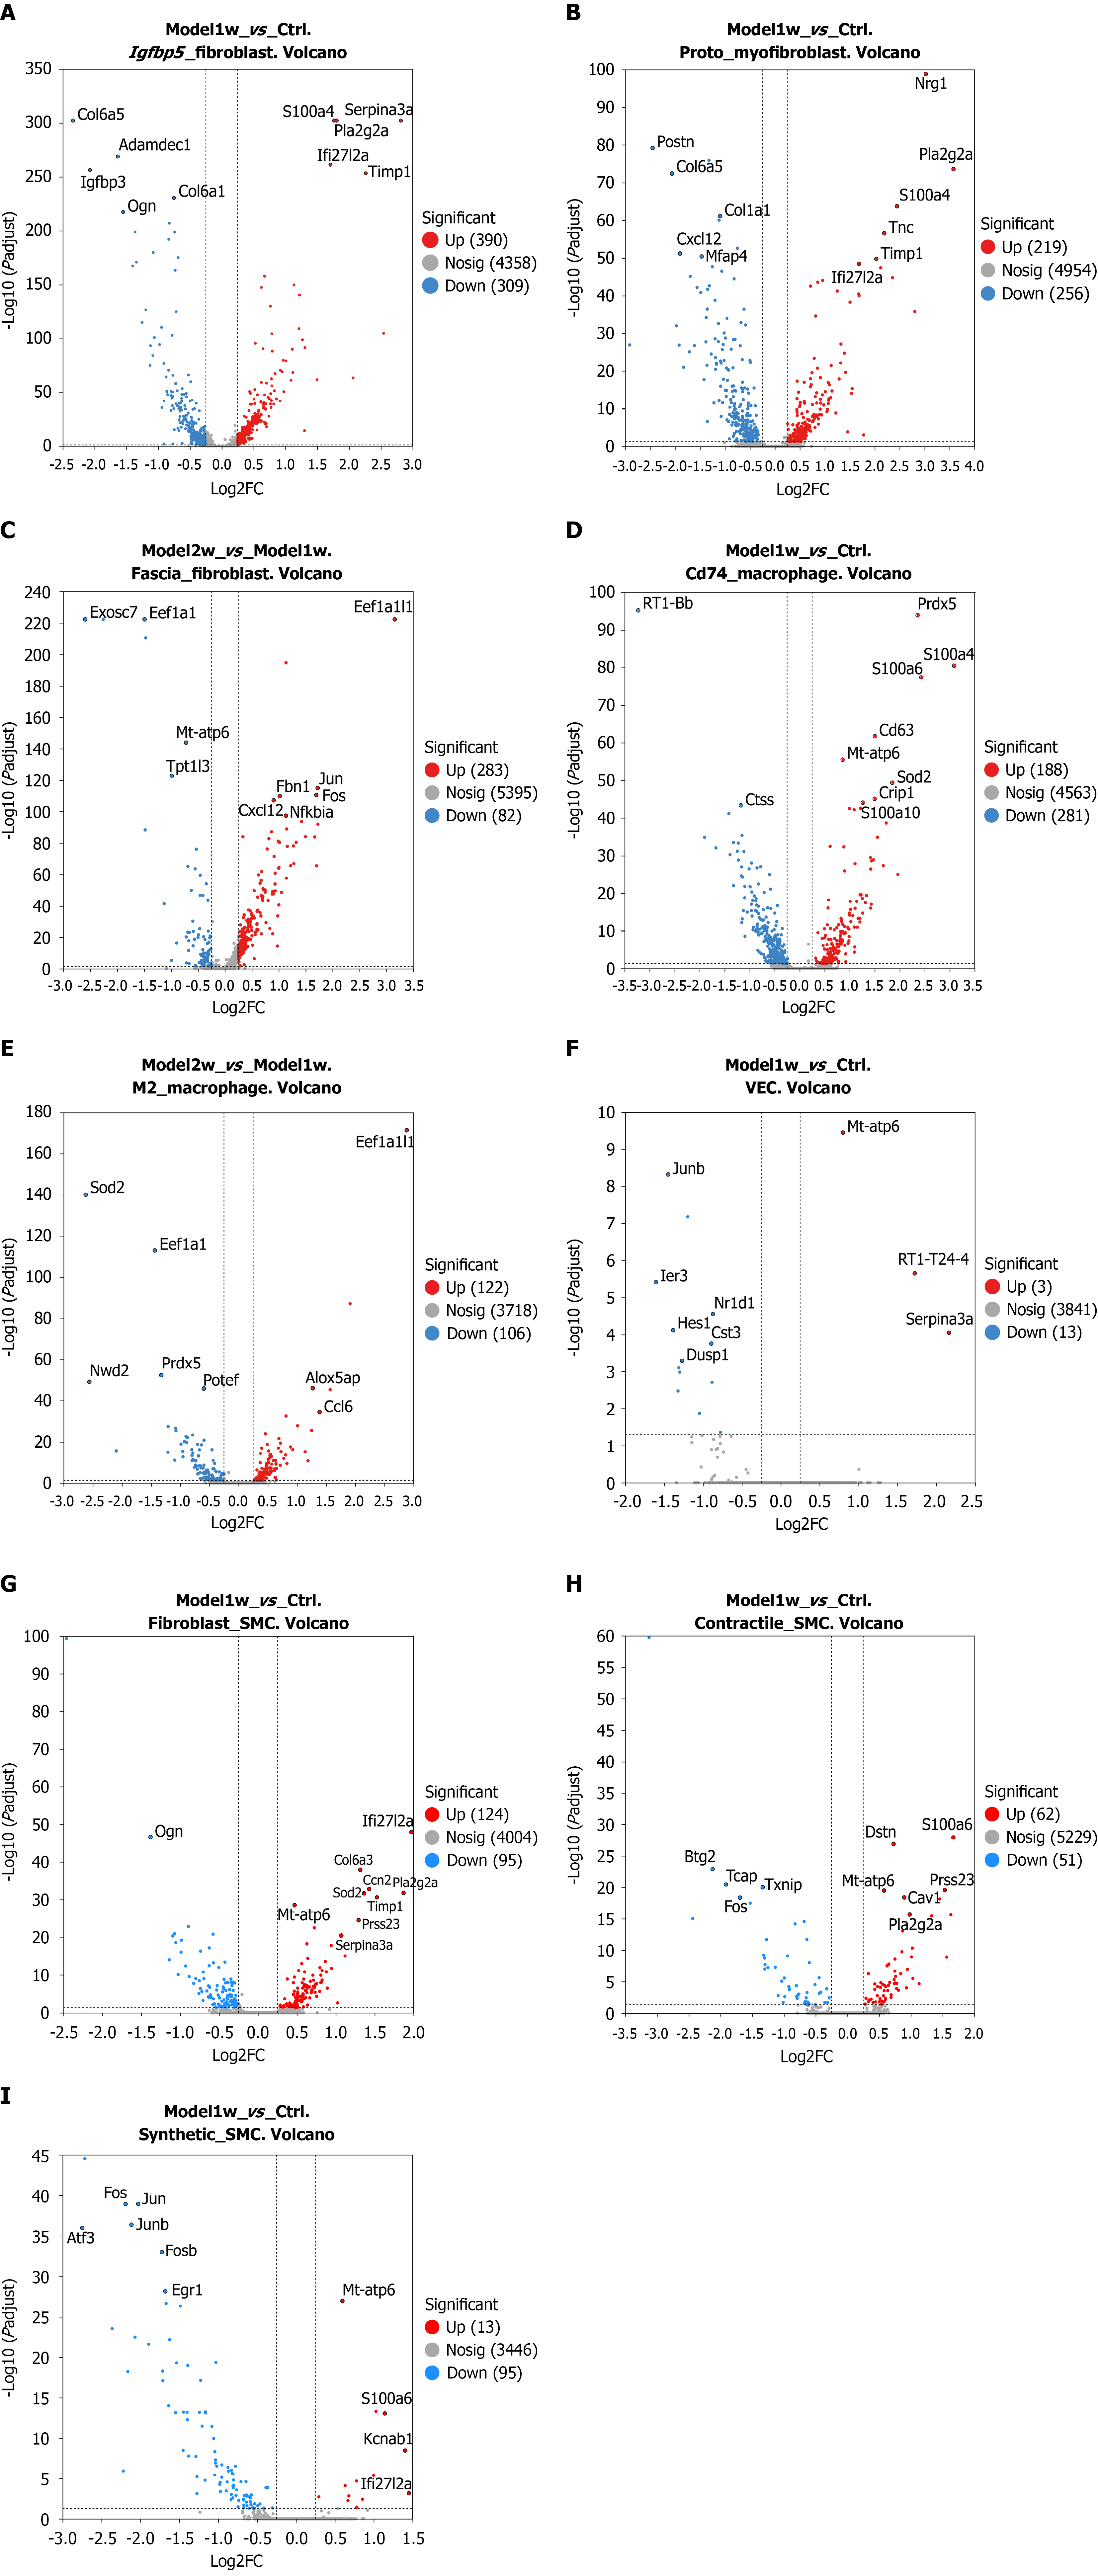
Figure 3 Volcano plots of differentially expressed genes.
The X-axes indicate the log2 fold change (log2FC) values for gene expression; the Y-axes indicate the adjusted P values (adjust P values). Adjust P < 0.05 was considered to indicate statistical significance. Each dot represents a gene: Red indicates significantly upregulated genes, blue indicates significantly downregulated genes, and gray indicates genes whose expression did not change significantly. Dots farther from the center or with larger values along the Y-axis indicate genes with more significant differences in expression. A: Igfbp5-fibroblast [1 week of modeling (Model-1w) vs control group (Ctrl)]; B: Protomyofibroblast (Model-1w vs Ctrl); C: Fascia-fibroblast [2 weeks of modeling (Model-2w) vs Model-1w]; D: Cd74-expressing macrophage (Model-1w vs Ctrl); E: M2 macrophage (Model-2w vs Model-1w); F: Vascular endothelial cell (Model-1w vs Ctrl); G: Fibroblast-smooth muscle cell (SMC) (Model-1w vs Ctrl); H: Contractile-SMC (Model-1w vs Ctrl); I: Synthetic-SMC (Model-1w vs Ctrl). Ctrl: Control group; Model-1w: 1 week of modeling; Model-2w: 2 weeks of modeling; VEC: Vascular endothelial cell; SMC: Smooth muscle cell.
- Citation: Lin WG, Huang SY, Lan H, Zheng XX, Liu XB, Xu ZG, Ke MH. Spatiotemporal atlas of internal hemorrhoids in rats elucidated using integrated single-cell RNA sequencing and spatial transcriptomics. World J Gastroenterol 2026; 32(41): 121893
- URL: https://www.wjgnet.com/1007-9327/full/v32/i41/121893.htm
- DOI: https://dx.doi.org/10.3748/wjg.121893