
















Copyright: ©Author(s) 2026.
World J Gastroenterol. Nov 7, 2026; 32(41): 121893
Published online Nov 7, 2026. doi: 10.3748/wjg.121893
Published online Nov 7, 2026. doi: 10.3748/wjg.121893
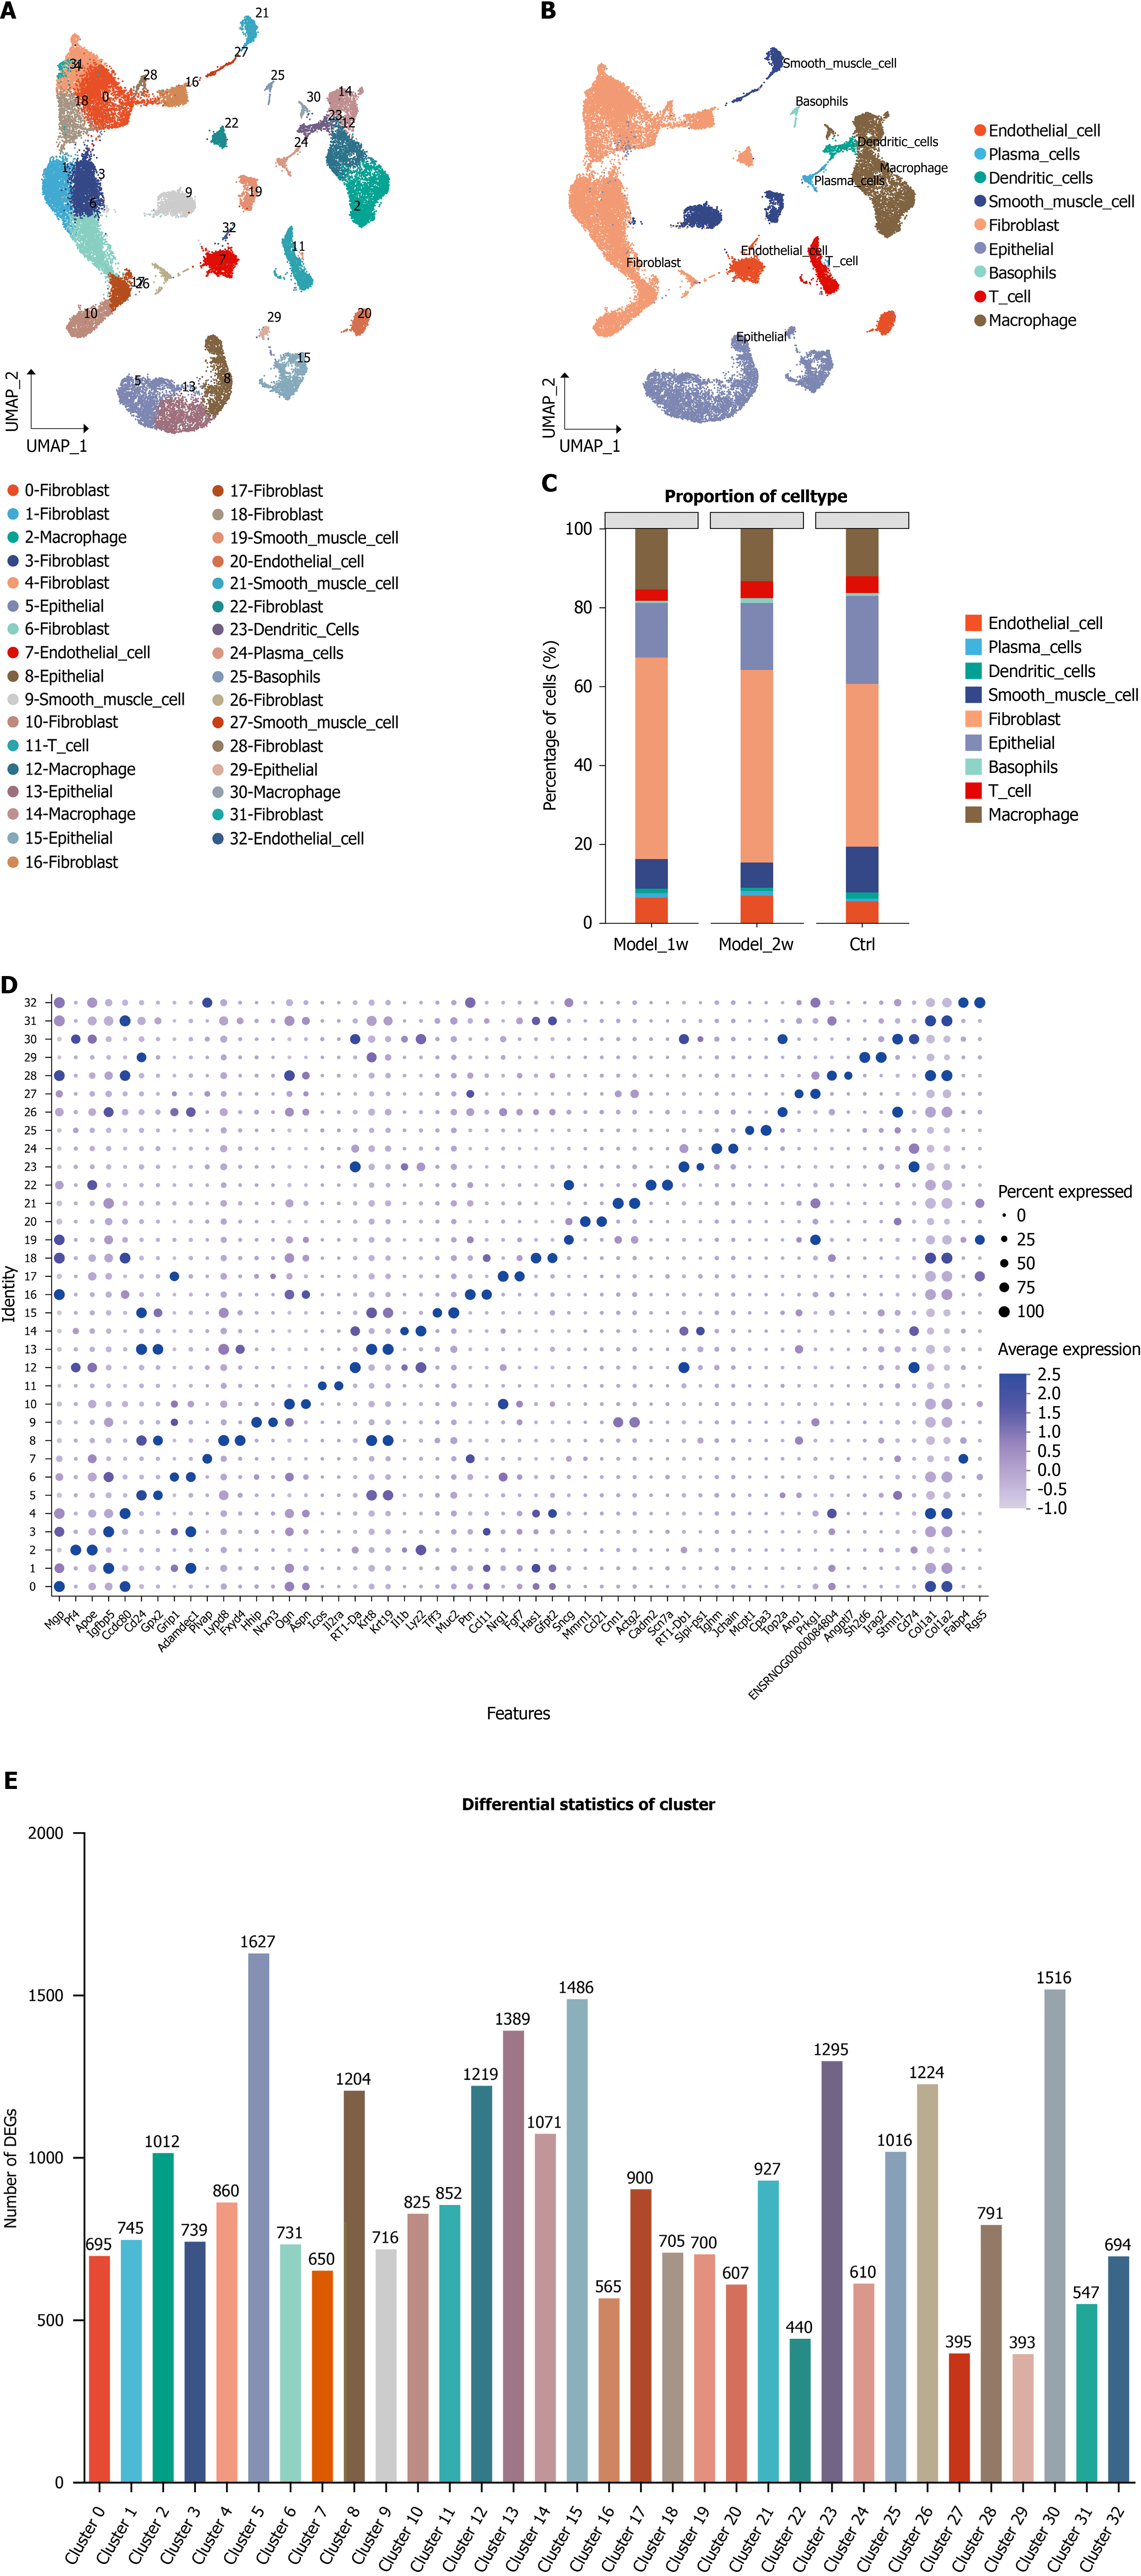
Figure 1 Single-cell transcriptomic landscape of internal hemorrhoidal.
A and B: The X-axis and Y-axis denote dimensionality-reduced components; different cell clusters are distinguished by distinct colors; C: Bar plot showing the relative proportions of 9 major cell types in the control, 1 week of modeling and 2 weeks of modeling groups (n = 5 rats per group). Differences in cell proportions among groups were analyzed using the Kruskal-Wallis H test with the Benjamini-Hochberg correction. Adjust P < 0.05 vs the control group; D: The X-axis indicates normalized gene expression; each dot indicates differential gene expression in each cell; and the Y-axis indicates clusters; E: The X-axis indicates colored clusters; the Y-axis indicates the number of differentially expressed genes per cluster.
- Citation: Lin WG, Huang SY, Lan H, Zheng XX, Liu XB, Xu ZG, Ke MH. Spatiotemporal atlas of internal hemorrhoids in rats elucidated using integrated single-cell RNA sequencing and spatial transcriptomics. World J Gastroenterol 2026; 32(41): 121893
- URL: https://www.wjgnet.com/1007-9327/full/v32/i41/121893.htm
- DOI: https://dx.doi.org/10.3748/wjg.121893