
















Copyright: ©Author(s) 2026.
World J Gastroenterol. Nov 7, 2026; 32(41): 121668
Published online Nov 7, 2026. doi: 10.3748/wjg.121668
Published online Nov 7, 2026. doi: 10.3748/wjg.121668
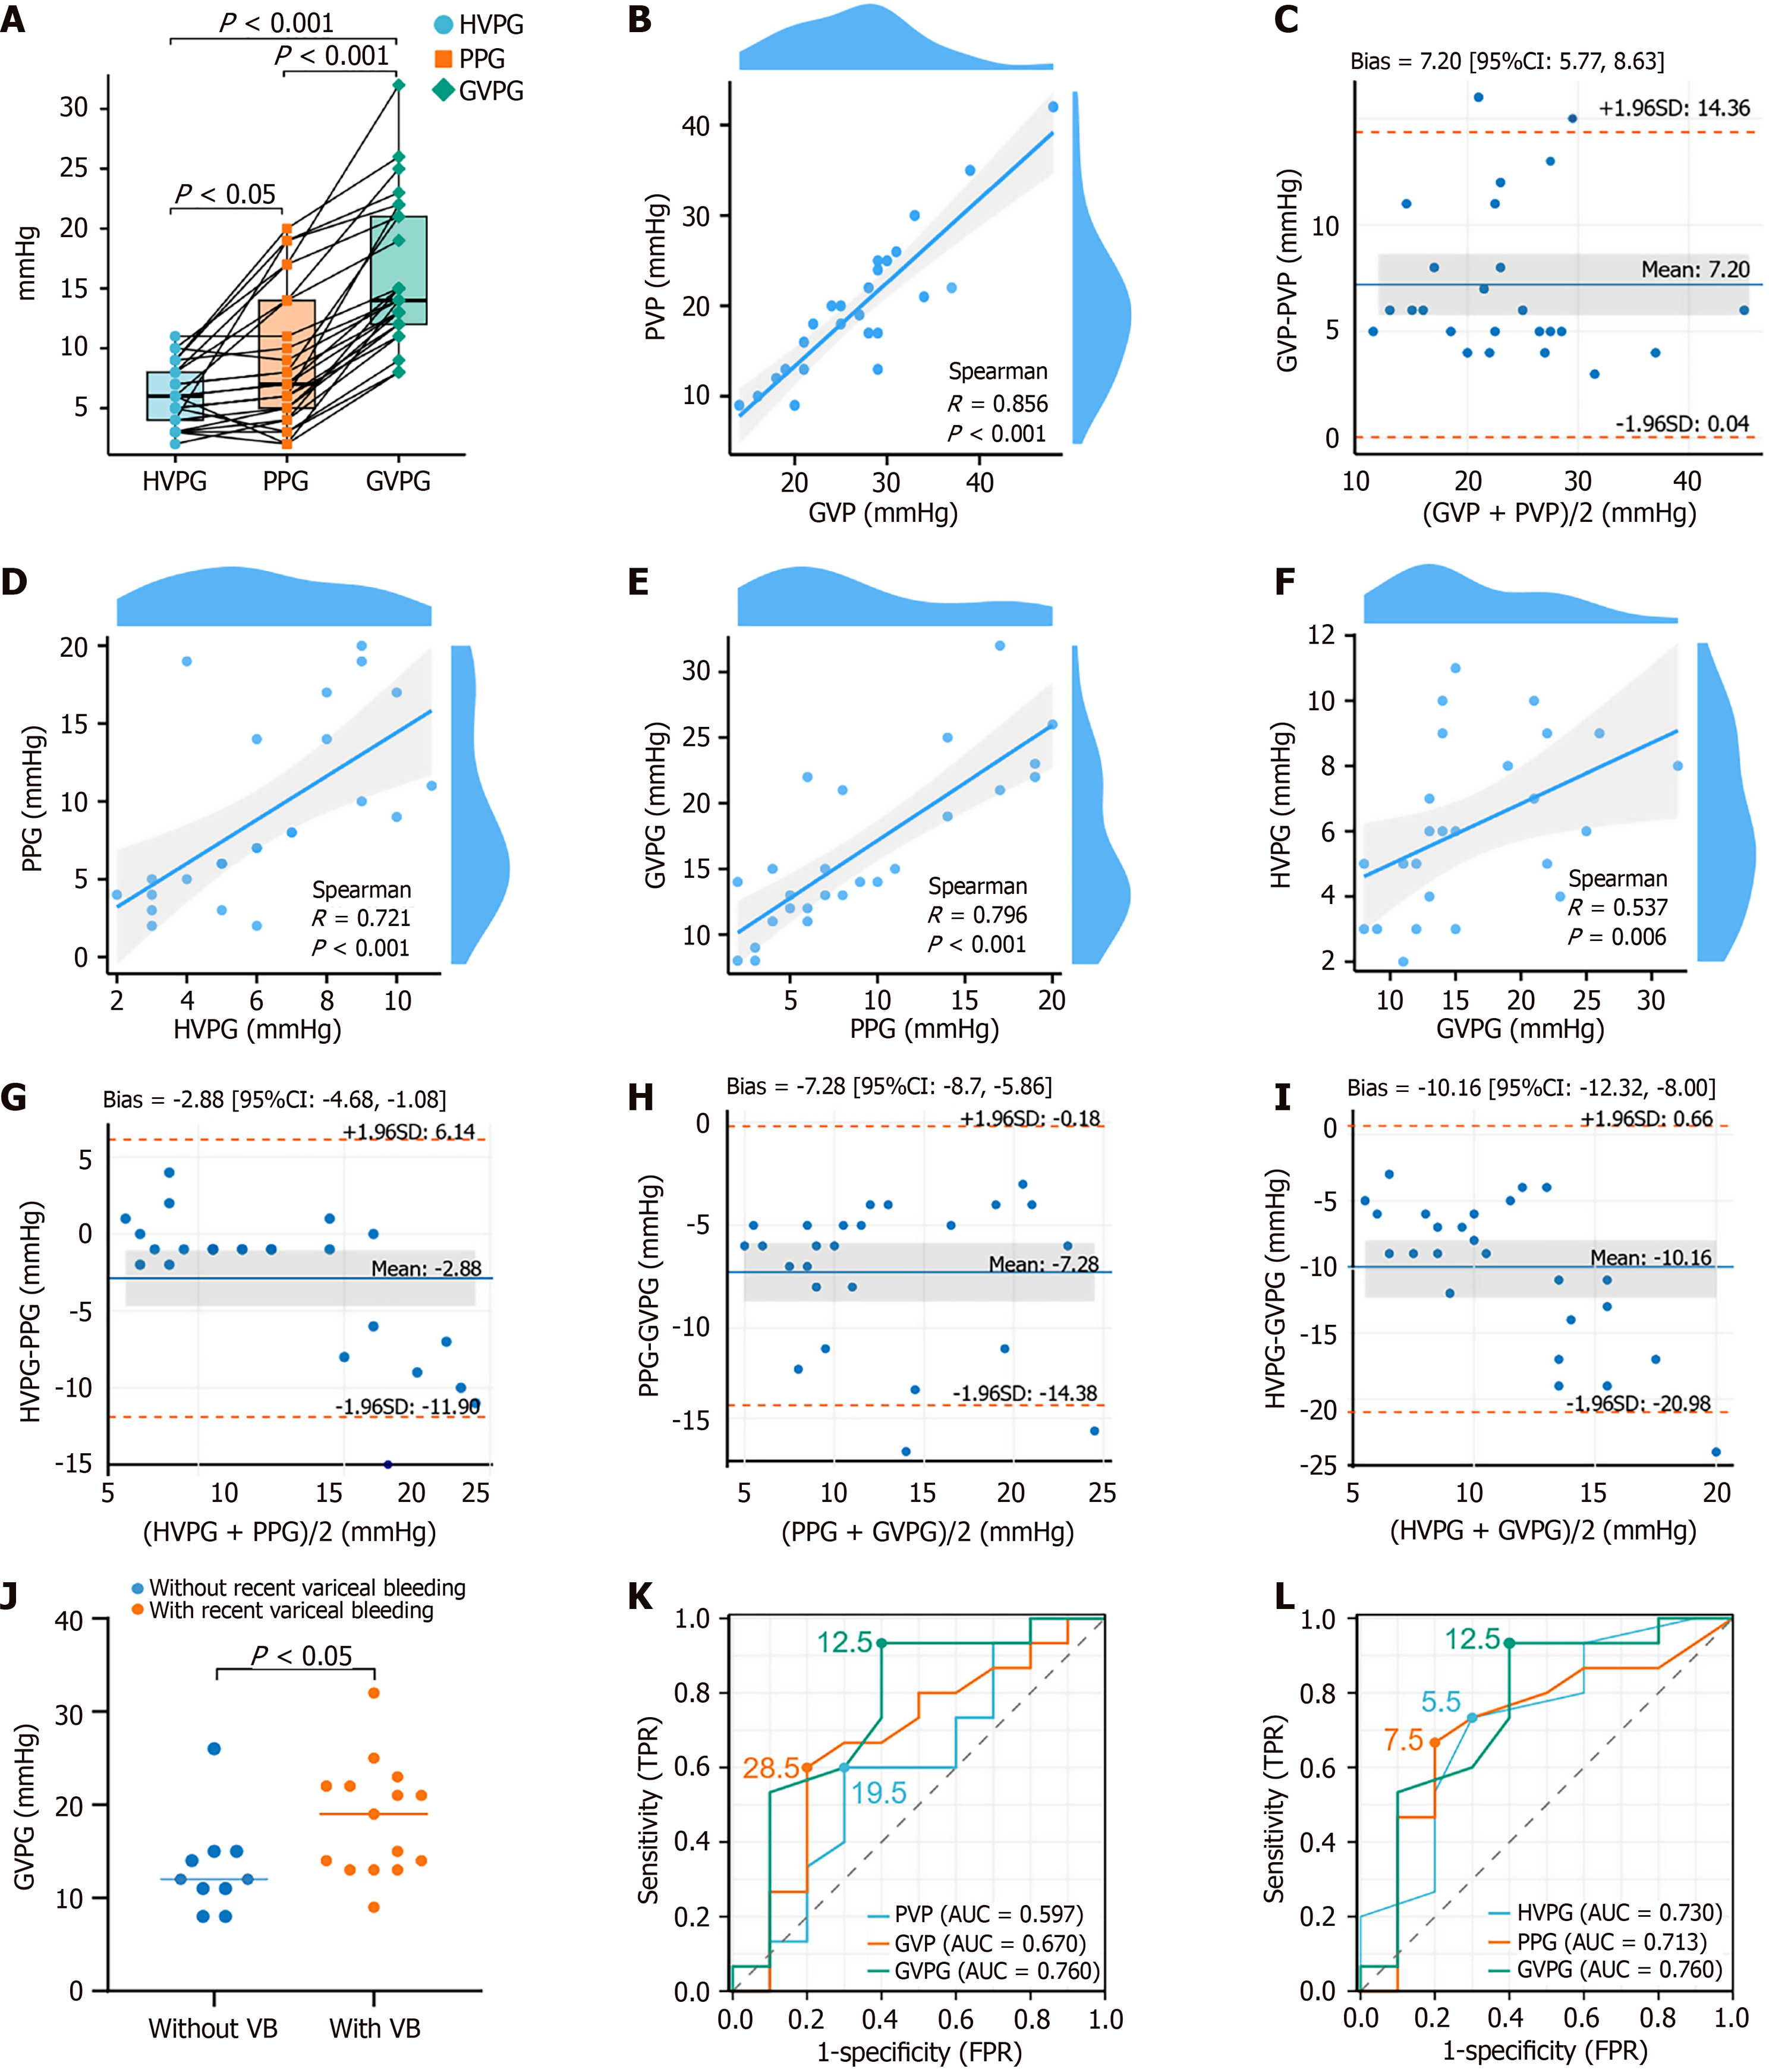
Figure 2 Hemodynamic comparisons and diagnostic performance of different portal pressure parameters.
A: Paired comparison of hepatic venous pressure gradient (HVPG), portal pressure gradient (PPG), and gastric varices pressure gradient (GVPG). GVPG consistently exceeded both PPG and HVPG (P < 0.001); B: Correlation between portal vein pressure (PVP) and gastric variceal pressure (GVP) (Spearman’ r = 0.856, P < 0.001); C: Bland-Altman analysis of GVP and PVP [mean bias, 7.20 mmHg; 95% confidence interval (CI): 5.77-8.63]; D: Correlation between HVPG and PPG (Spearman’ r = 0.721, P < 0.001); E: Correlation between PPG and GVPG (Spearman’ r = 0.796, P < 0.001); F: Correlation between GVPG and HVPG (Spearman’ r = 0.537, P = 0.006); G: Bland-Altman analysis of HVPF and PPG (mean bias, -2.88 mmHg; 95%CI: -4.68 to -1.08); H: Bland-Altman analysis of PPG and GVPG (mean bias, -7.28 mmHg; 95%CI: -8.70 to -5.86); I: Bland-Altman analysis of HVPG and GVPG (mean bias, -10.16 mmHg; 95%CI: -12.32 to -8.00); J: Comparison of GVPG between patients with and without recent variceal bleeding. GVPG was significantly higher in patients with recent bleeding (18.40 ± 6.07 mmHg vs 13.20 ± 5.13 mmHg, P = 0.030); K: Receiver operating characteristic (ROC) curves of PVP, GVP, and GVPG. The area under the ROC curve (AUC) for discriminating patients with and without recent variceal bleeding were 0597, 0.670, and 0.760, respectively; L: ROC curves of HVPG, PPG, and GVPG. The AUCs for discriminating patients with and without recent variceal bleeding were 0730, 0.713, and 0.760, respectively. HVPG: Hepatic venous pressure gradient; PPG: Portal pressure gradient; GVPG: Gastric varices pressure gradient; PVP: Portal vein pressure; GVP: Gastric variceal pressure; CI: Confidence interval; VB: Variceal bleeding; TPR: True positive rate; FPR: False positive rate; AUC: Area under the curve.
- Citation: Wei W, Xue M, Xu LY. Gastric variceal pressure gradient in patients with large spontaneous shunts: A novel approach to local hemodynamic assessment. World J Gastroenterol 2026; 32(41): 121668
- URL: https://www.wjgnet.com/1007-9327/full/v32/i41/121668.htm
- DOI: https://dx.doi.org/10.3748/wjg.121668