
















Copyright: ©Author(s) 2026.
World J Gastroenterol. Nov 7, 2026; 32(41): 121527
Published online Nov 7, 2026. doi: 10.3748/wjg.121527
Published online Nov 7, 2026. doi: 10.3748/wjg.121527
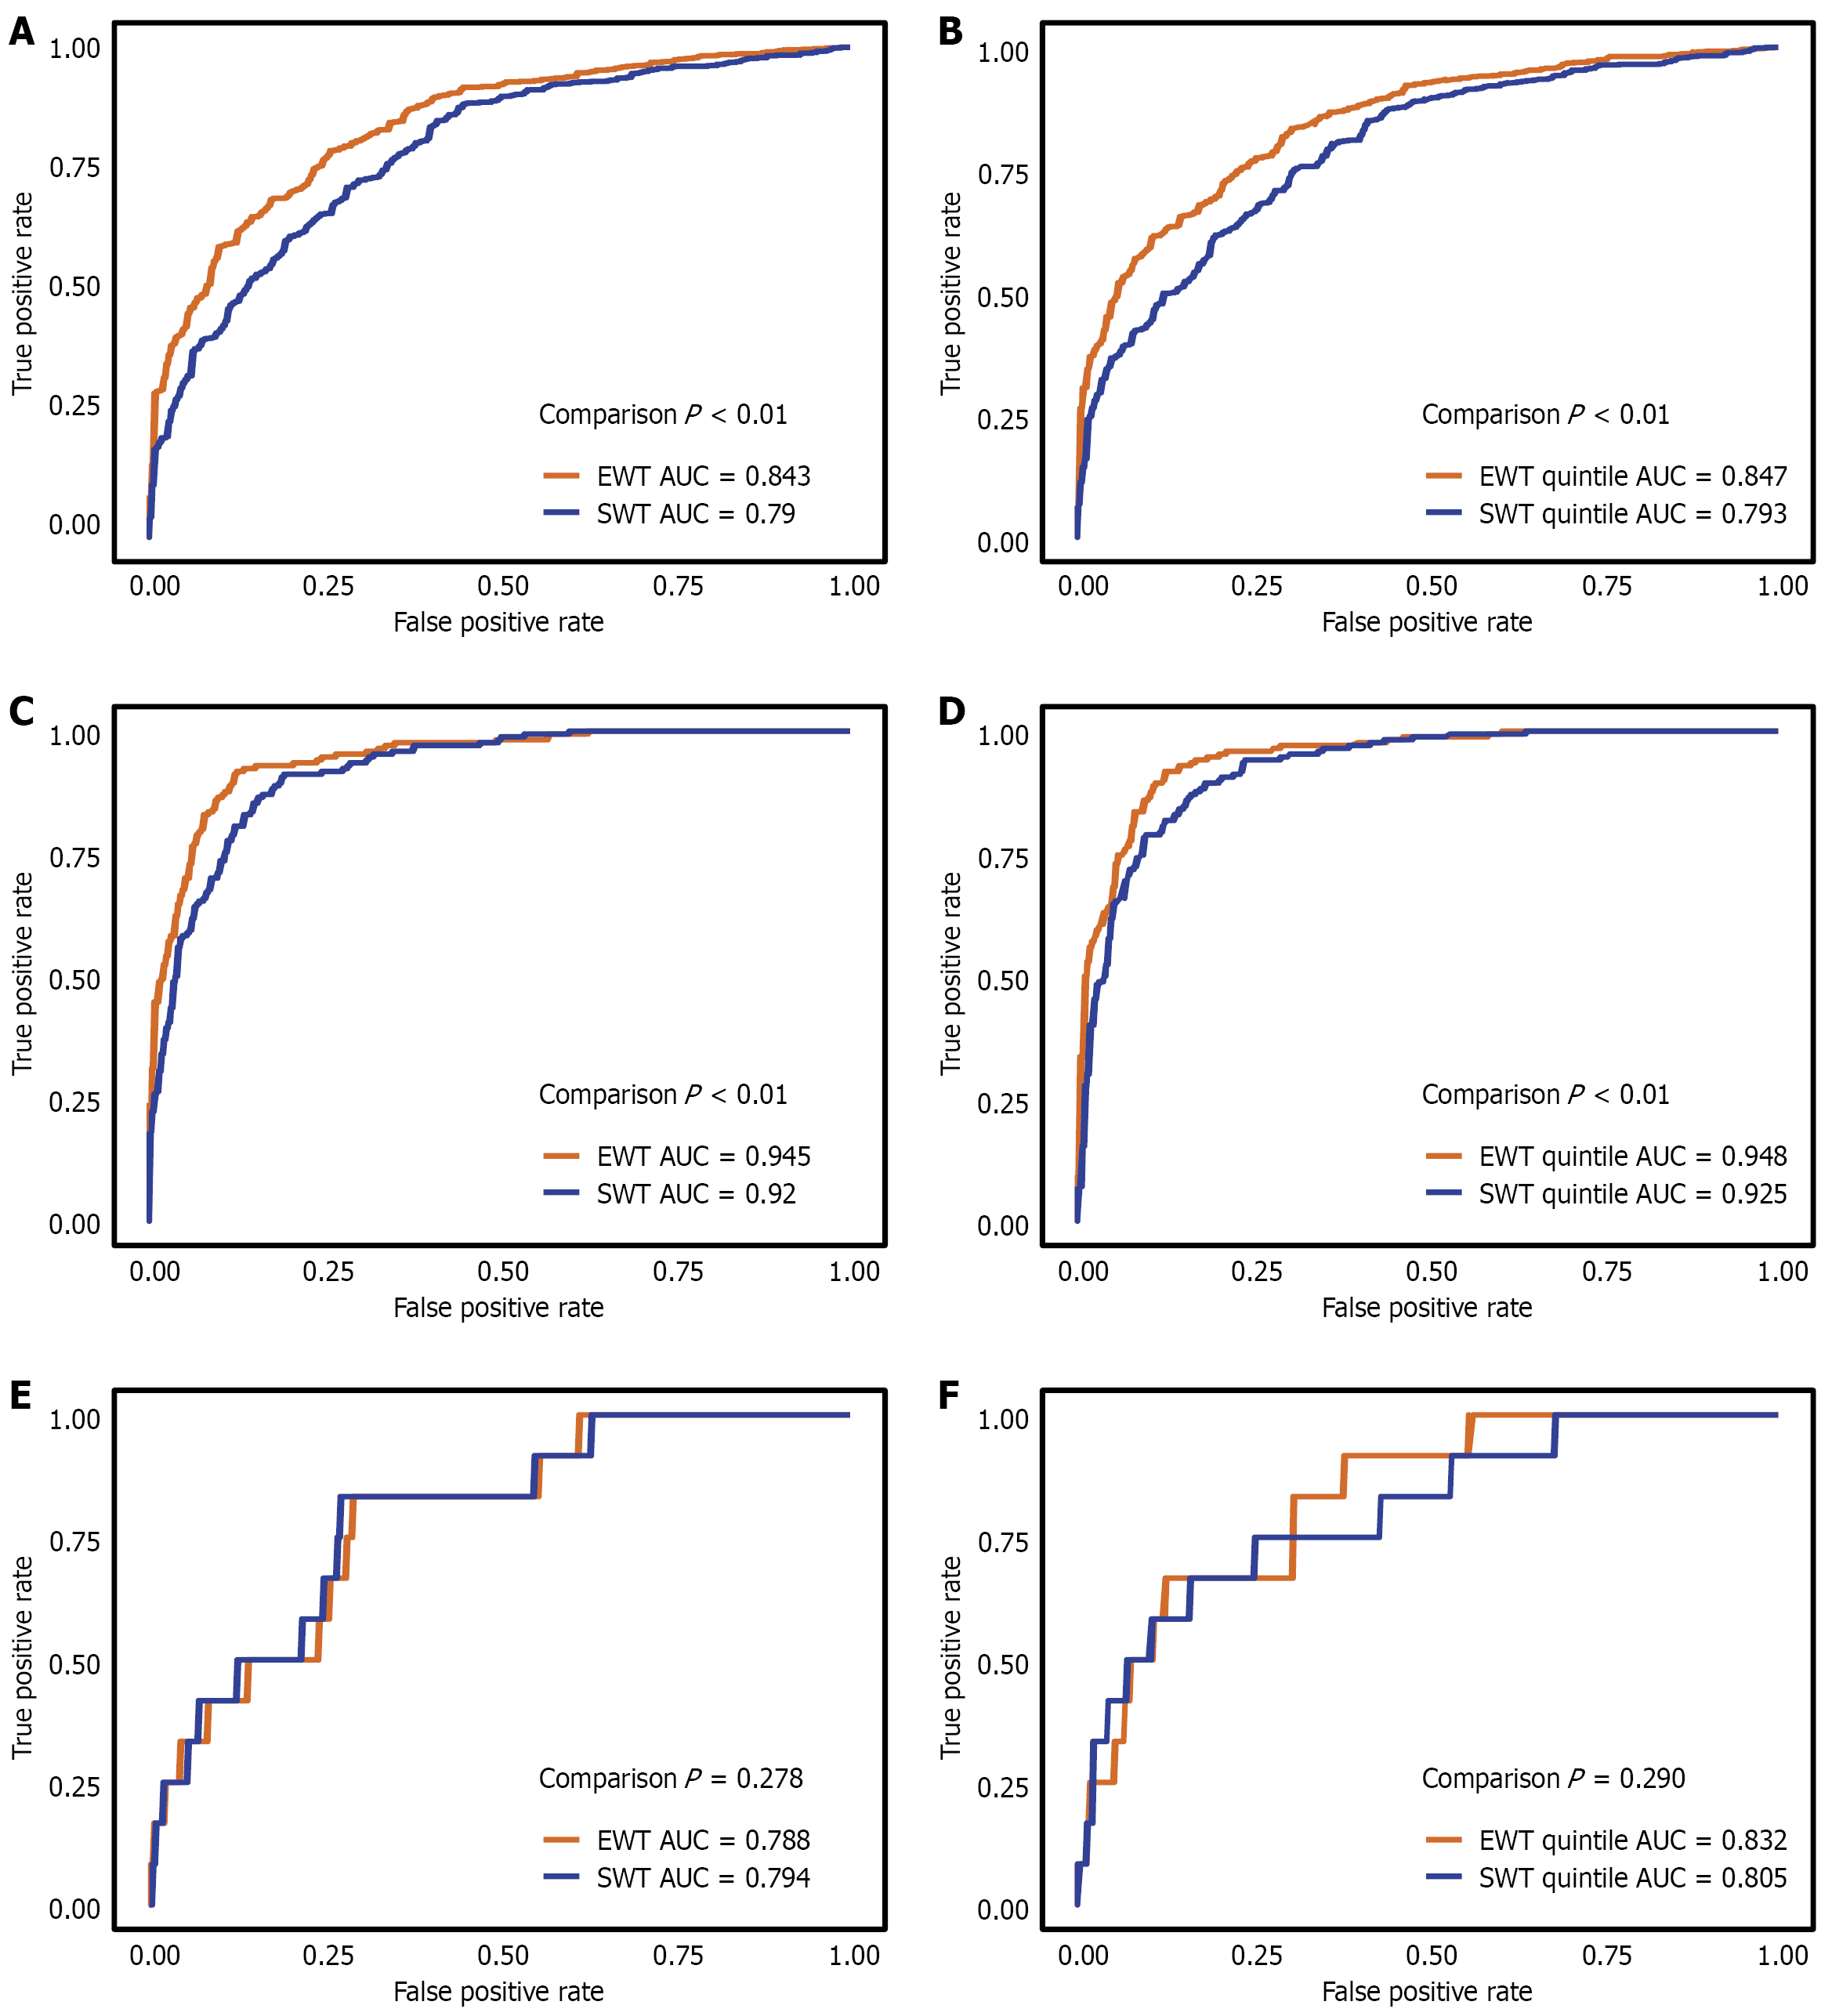
Figure 3 Comparative predictive performance of withdrawal times for lesion detection.
A: Receiver operating characteristic (ROC) curve for polyp detection using the continuous model, comparing effective withdrawal time (EWT) (orange) and standard withdrawal time (SWT) (blue); B: ROC curve for polyp detection using the quintile model, comparing EWT (orange) and SWT (blue); C: ROC curve for adenoma detection using the continuity model, comparing EWT (orange) and SWT (blue); D: ROC curve for adenoma detection using the quintile model, comparing EWT (orange) and SWT (blue); E: ROC curve for colorectal cancer detection using the continuity model, comparing EWT (orange) and SWT (blue); F: ROC curve for colorectal cancer detection using the quintile model, comparing EWT (orange) and SWT (blue). EWT: Effective withdrawal time; SWT: Standard withdrawal time; AUC: Area under the curve.
- Citation: Peng ZY, Li JX, Huang Y, Wang XY, An Q, Yin ZY, Li YR, Sun JY, Wang YW, Yang X, Zhang Q, Wang XM, Zhang SY, Pei ZC. Disentangling true inspection time from therapeutic intervals: Validation of effective withdrawal time as a colonoscopy quality metric. World J Gastroenterol 2026; 32(41): 121527
- URL: https://www.wjgnet.com/1007-9327/full/v32/i41/121527.htm
- DOI: https://dx.doi.org/10.3748/wjg.121527