
















©The Author(s) 2026.
World J Gastroenterol. Jan 28, 2026; 32(4): 114420
Published online Jan 28, 2026. doi: 10.3748/wjg.v32.i4.114420
Published online Jan 28, 2026. doi: 10.3748/wjg.v32.i4.114420
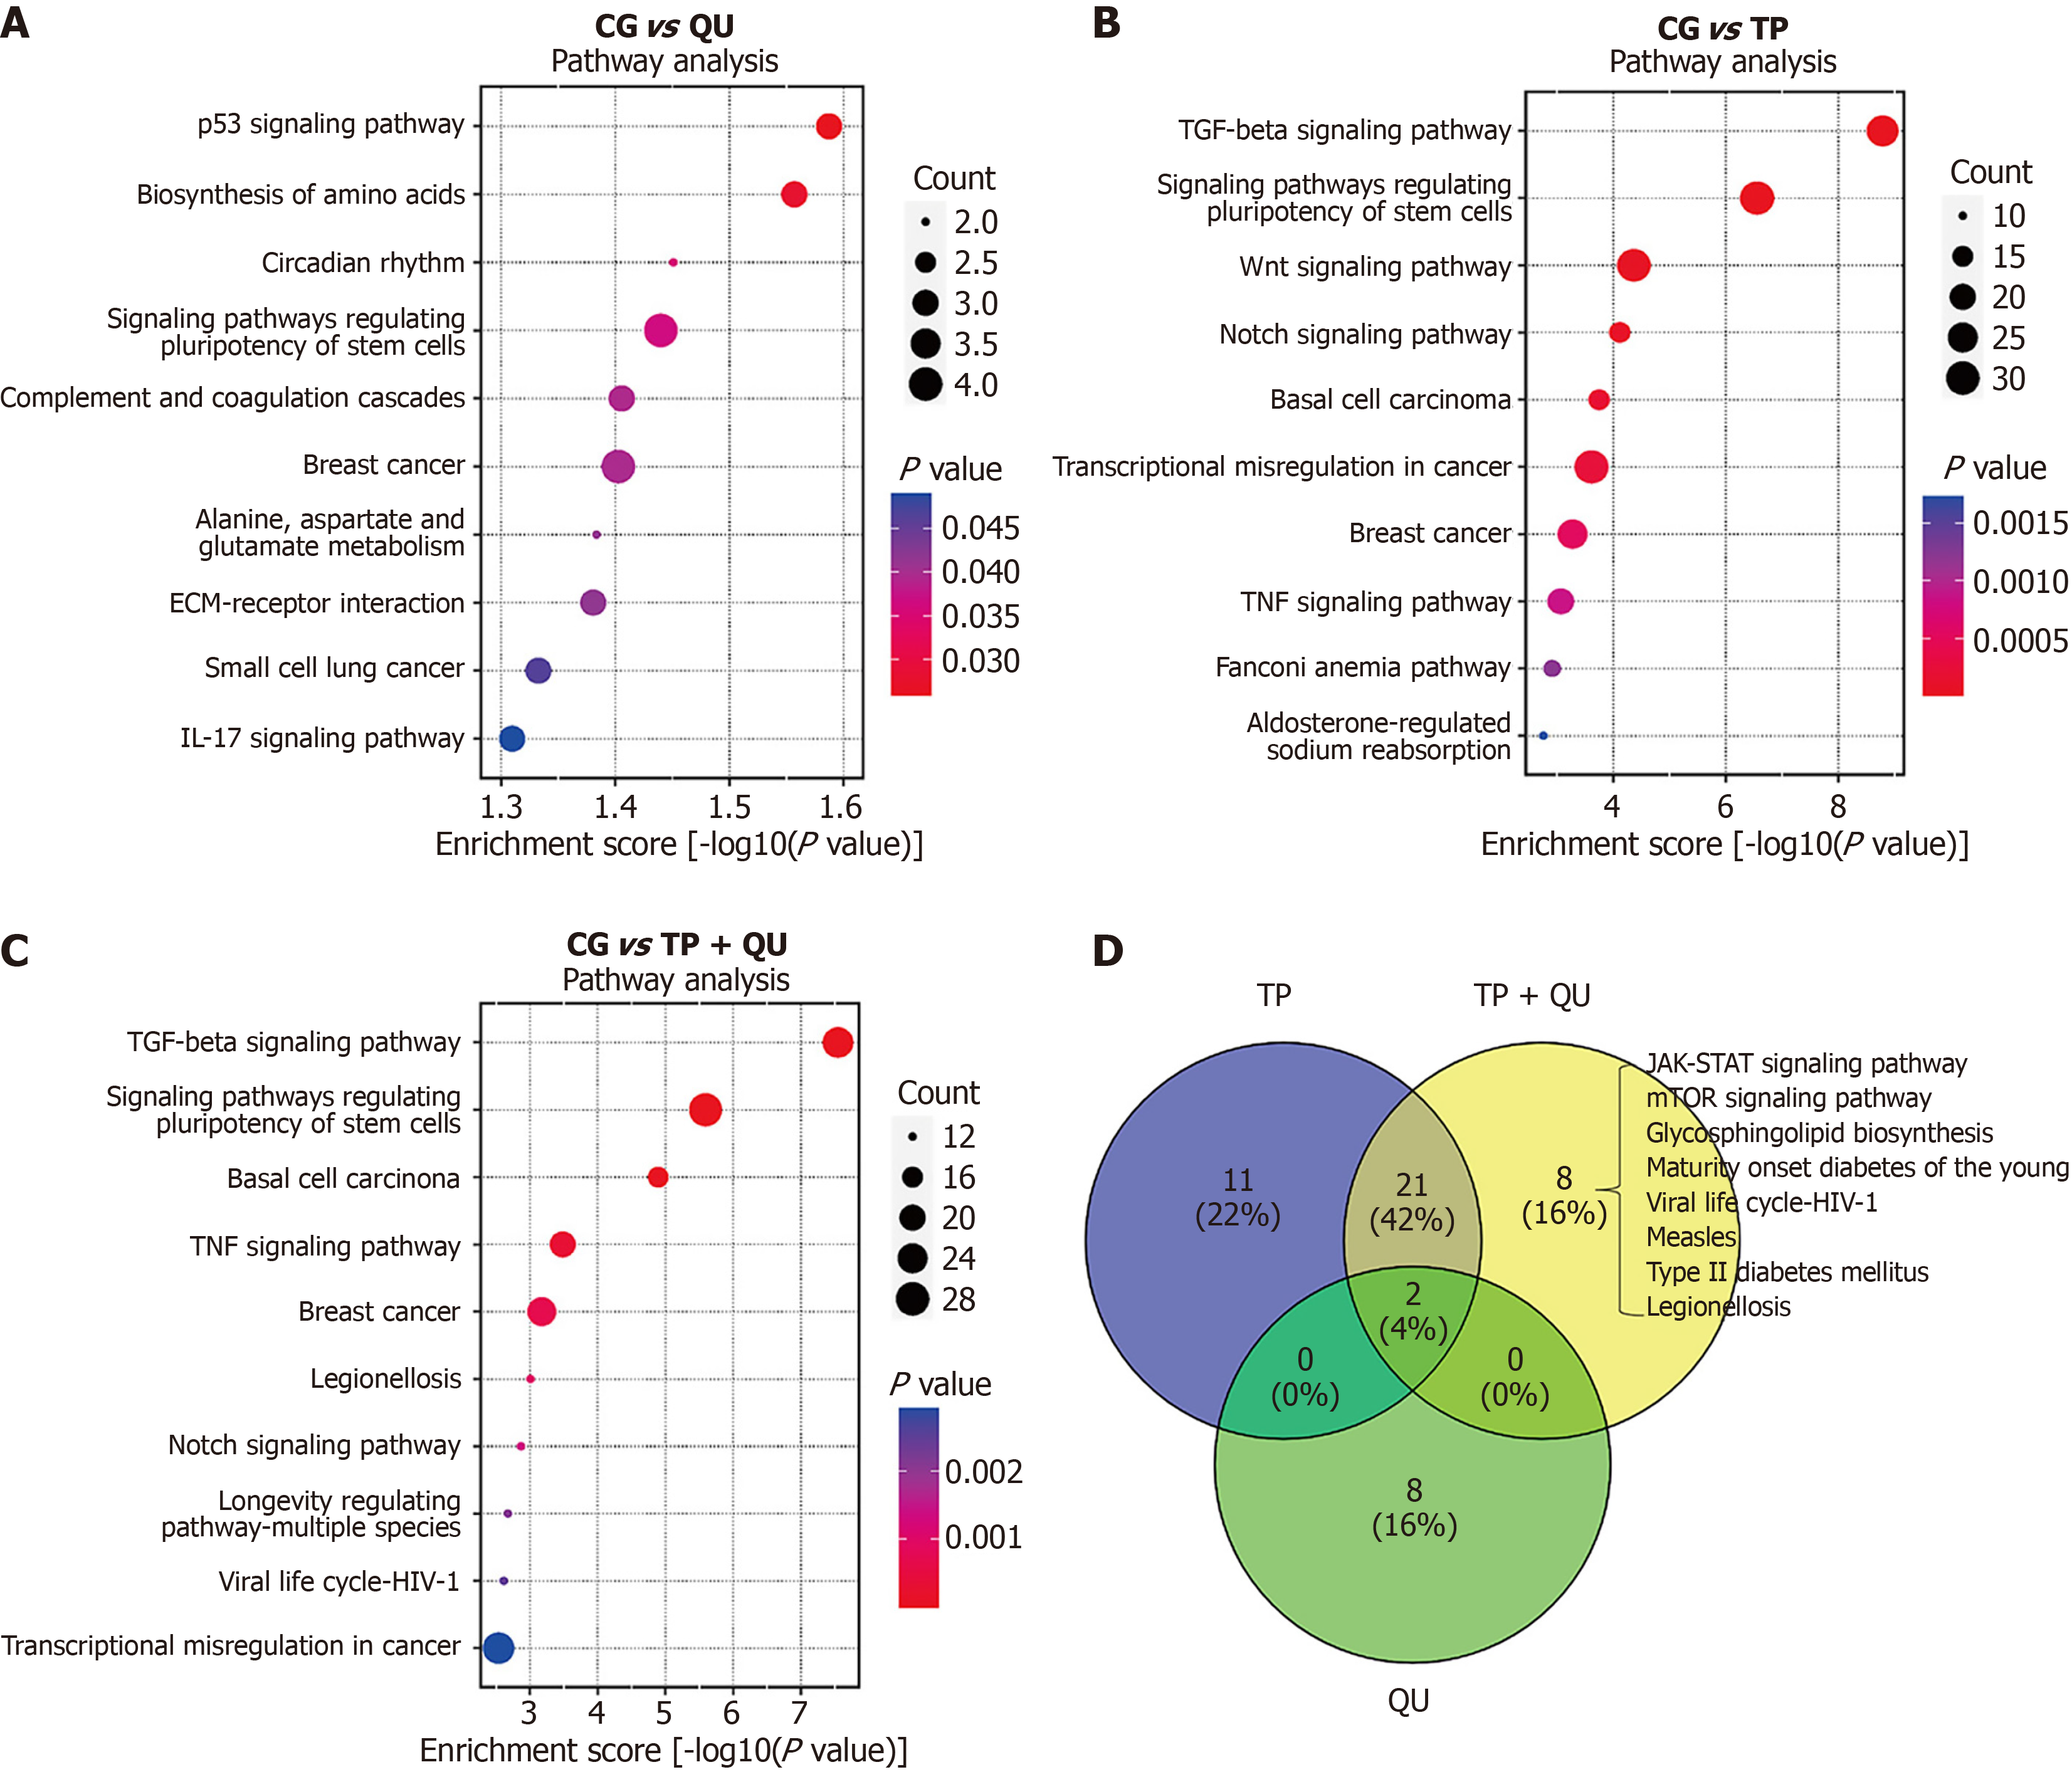
Figure 9 Pathway functional analysis by Kyoto Encyclopedia of Genes and Genomes compared with control group based on RNA sequencing.
A: The top ten signaling pathways with the greatest statistical difference for control group compared with quercetin; B: The top ten signaling pathways with the greatest statistical difference for control group compared with triptolide; C: The top ten signaling pathways with the greatest statistical difference for control group compared with triptolide + quercetin; D: The Venn diagram of signaling pathways for three different drug interventions groups compared with control group. TP: Triptolide; QU: Quercetin.
- Citation: Tong HX, Zhang JL, Nie WY, Jiang LJ, Hu JQ, Lu T. Synergistic anti-hepatoma effect of triptolide and quercetin via co-inhibition and interaction with Janus kinase and mammalian target of rapamycin signal pathway. World J Gastroenterol 2026; 32(4): 114420
- URL: https://www.wjgnet.com/1007-9327/full/v32/i4/114420.htm
- DOI: https://dx.doi.org/10.3748/wjg.v32.i4.114420