
















©The Author(s) 2026.
World J Gastroenterol. Jan 28, 2026; 32(4): 114420
Published online Jan 28, 2026. doi: 10.3748/wjg.v32.i4.114420
Published online Jan 28, 2026. doi: 10.3748/wjg.v32.i4.114420
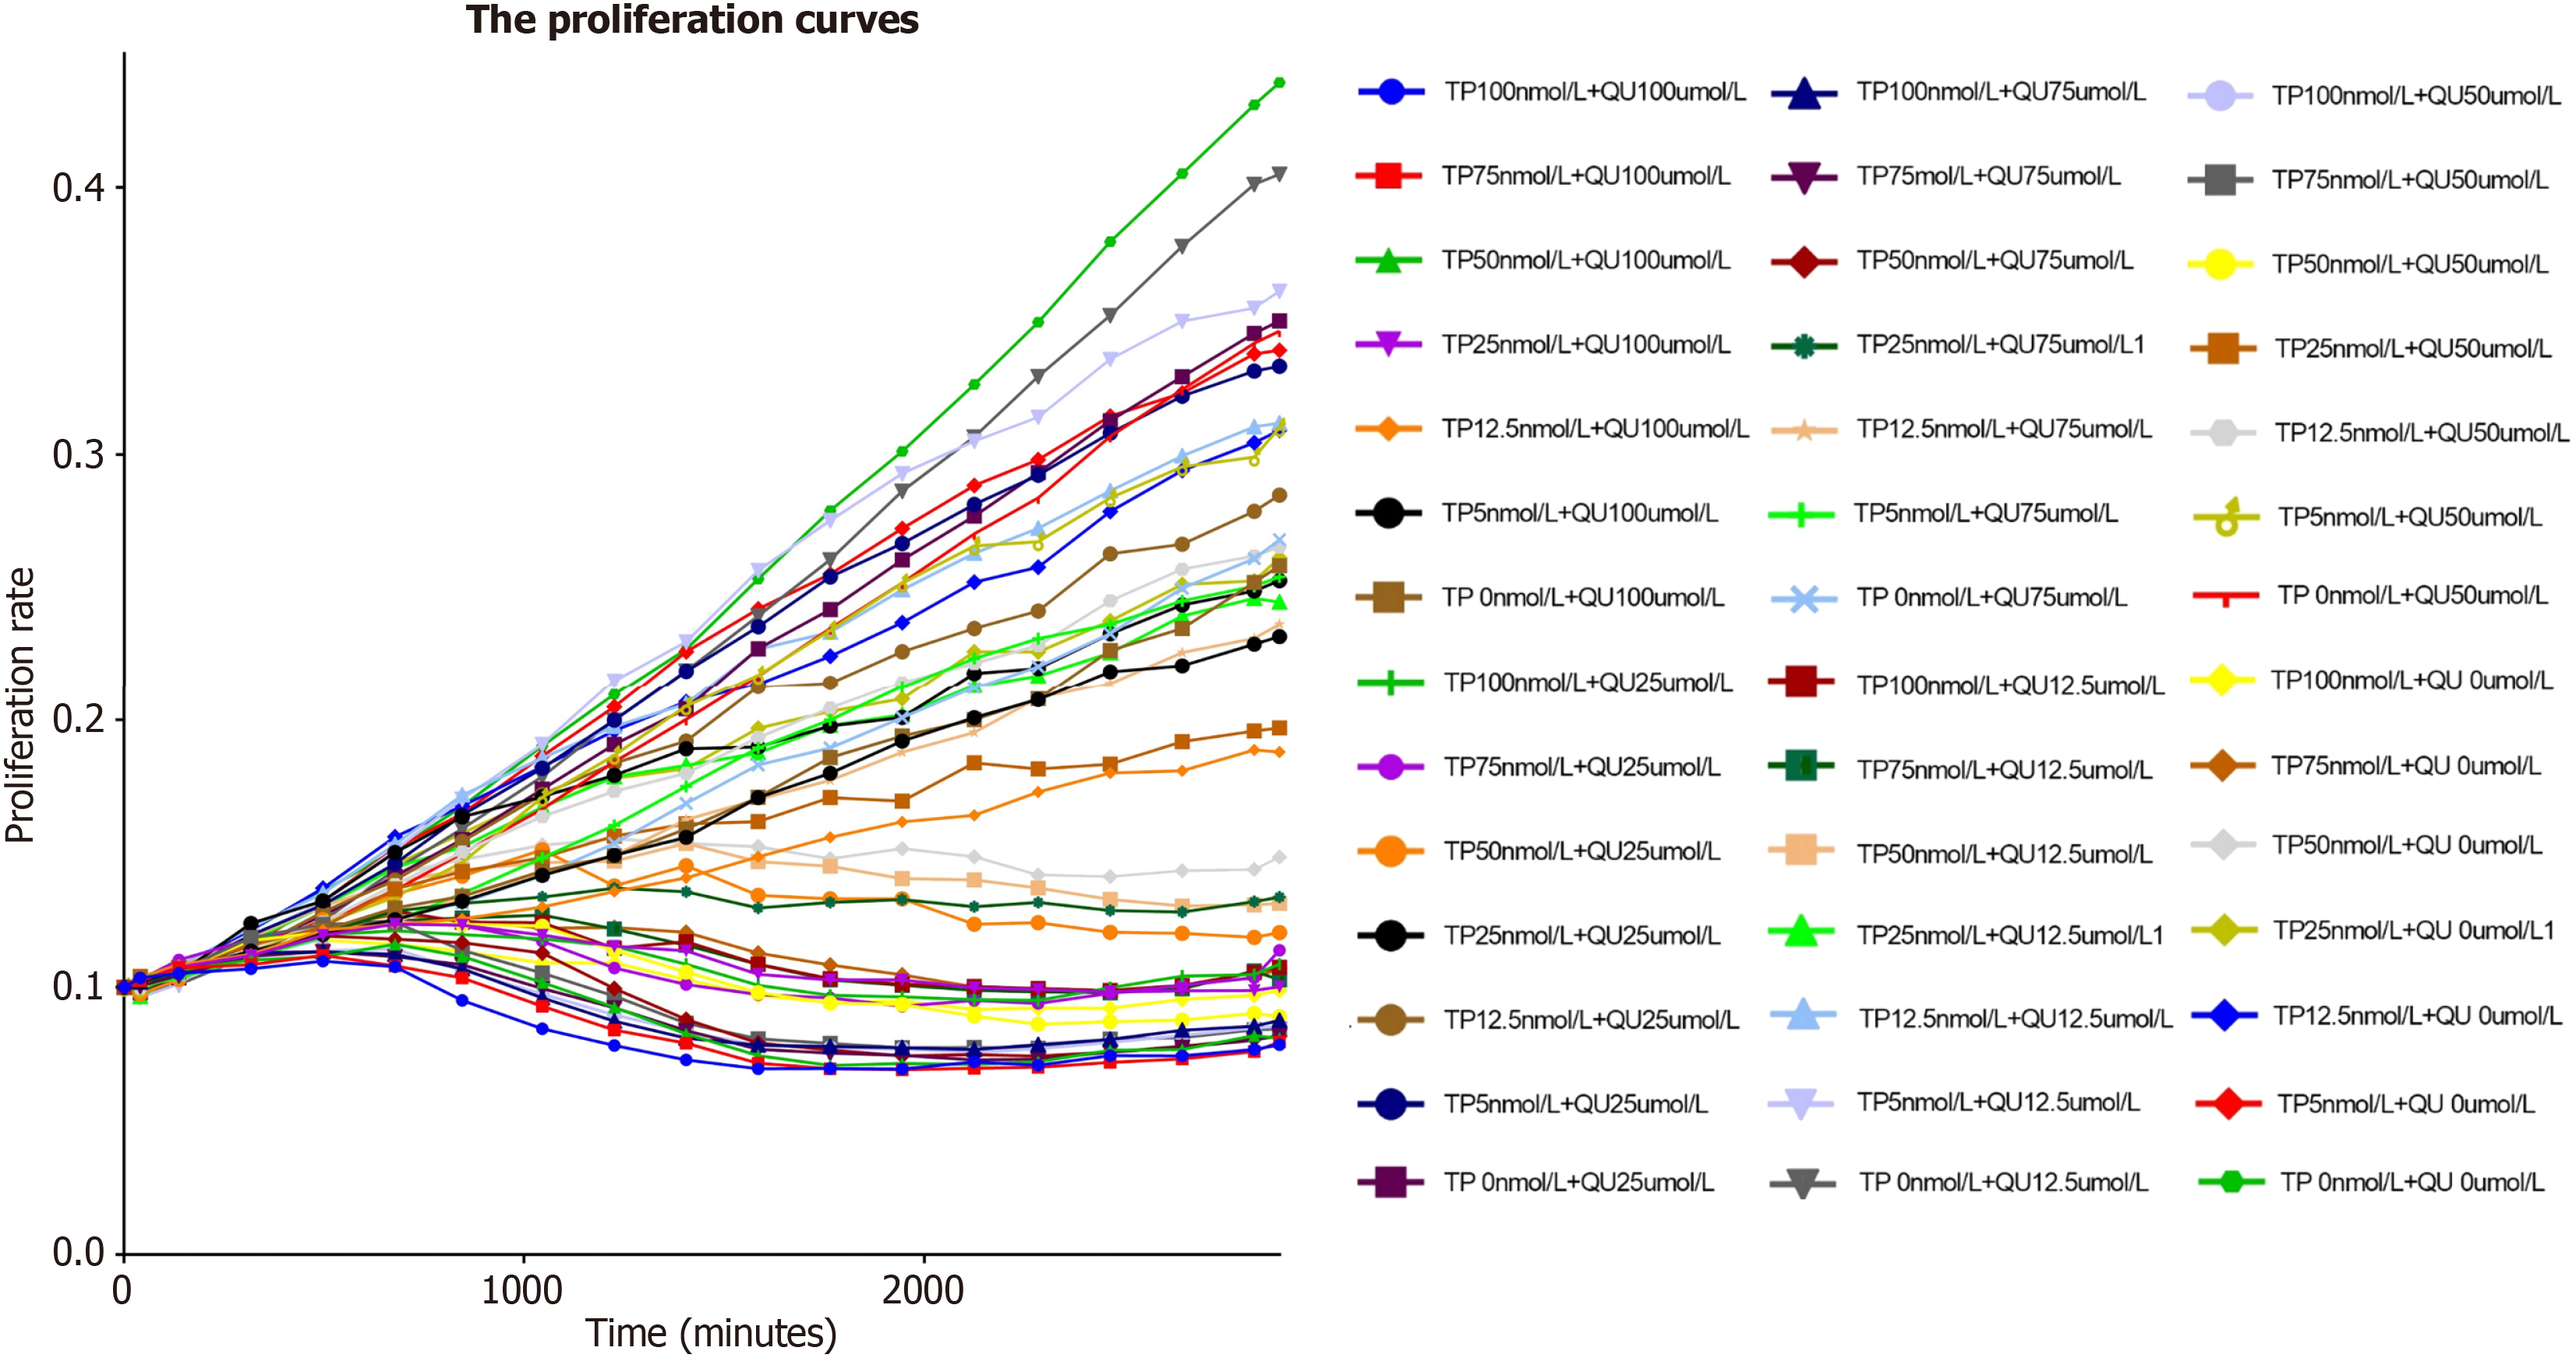
Figure 2 The proliferation curves of different dose combinations between quercetin and triptolide using IncuCyteZOOM 2015A.
The combination of various doses was added to the cells and they were cultured in IncuCyteZOOM 2015A. We took pictures of each group every 3 hours. Then the software could change them into data of proliferation. TP: Triptolide; QU: Quercetin.
- Citation: Tong HX, Zhang JL, Nie WY, Jiang LJ, Hu JQ, Lu T. Synergistic anti-hepatoma effect of triptolide and quercetin via co-inhibition and interaction with Janus kinase and mammalian target of rapamycin signal pathway. World J Gastroenterol 2026; 32(4): 114420
- URL: https://www.wjgnet.com/1007-9327/full/v32/i4/114420.htm
- DOI: https://dx.doi.org/10.3748/wjg.v32.i4.114420