
















Copyright: ©Author(s) 2026.
World J Gastroenterol. Oct 21, 2026; 32(39): 121007
Published online Oct 21, 2026. doi: 10.3748/wjg.121007
Published online Oct 21, 2026. doi: 10.3748/wjg.121007
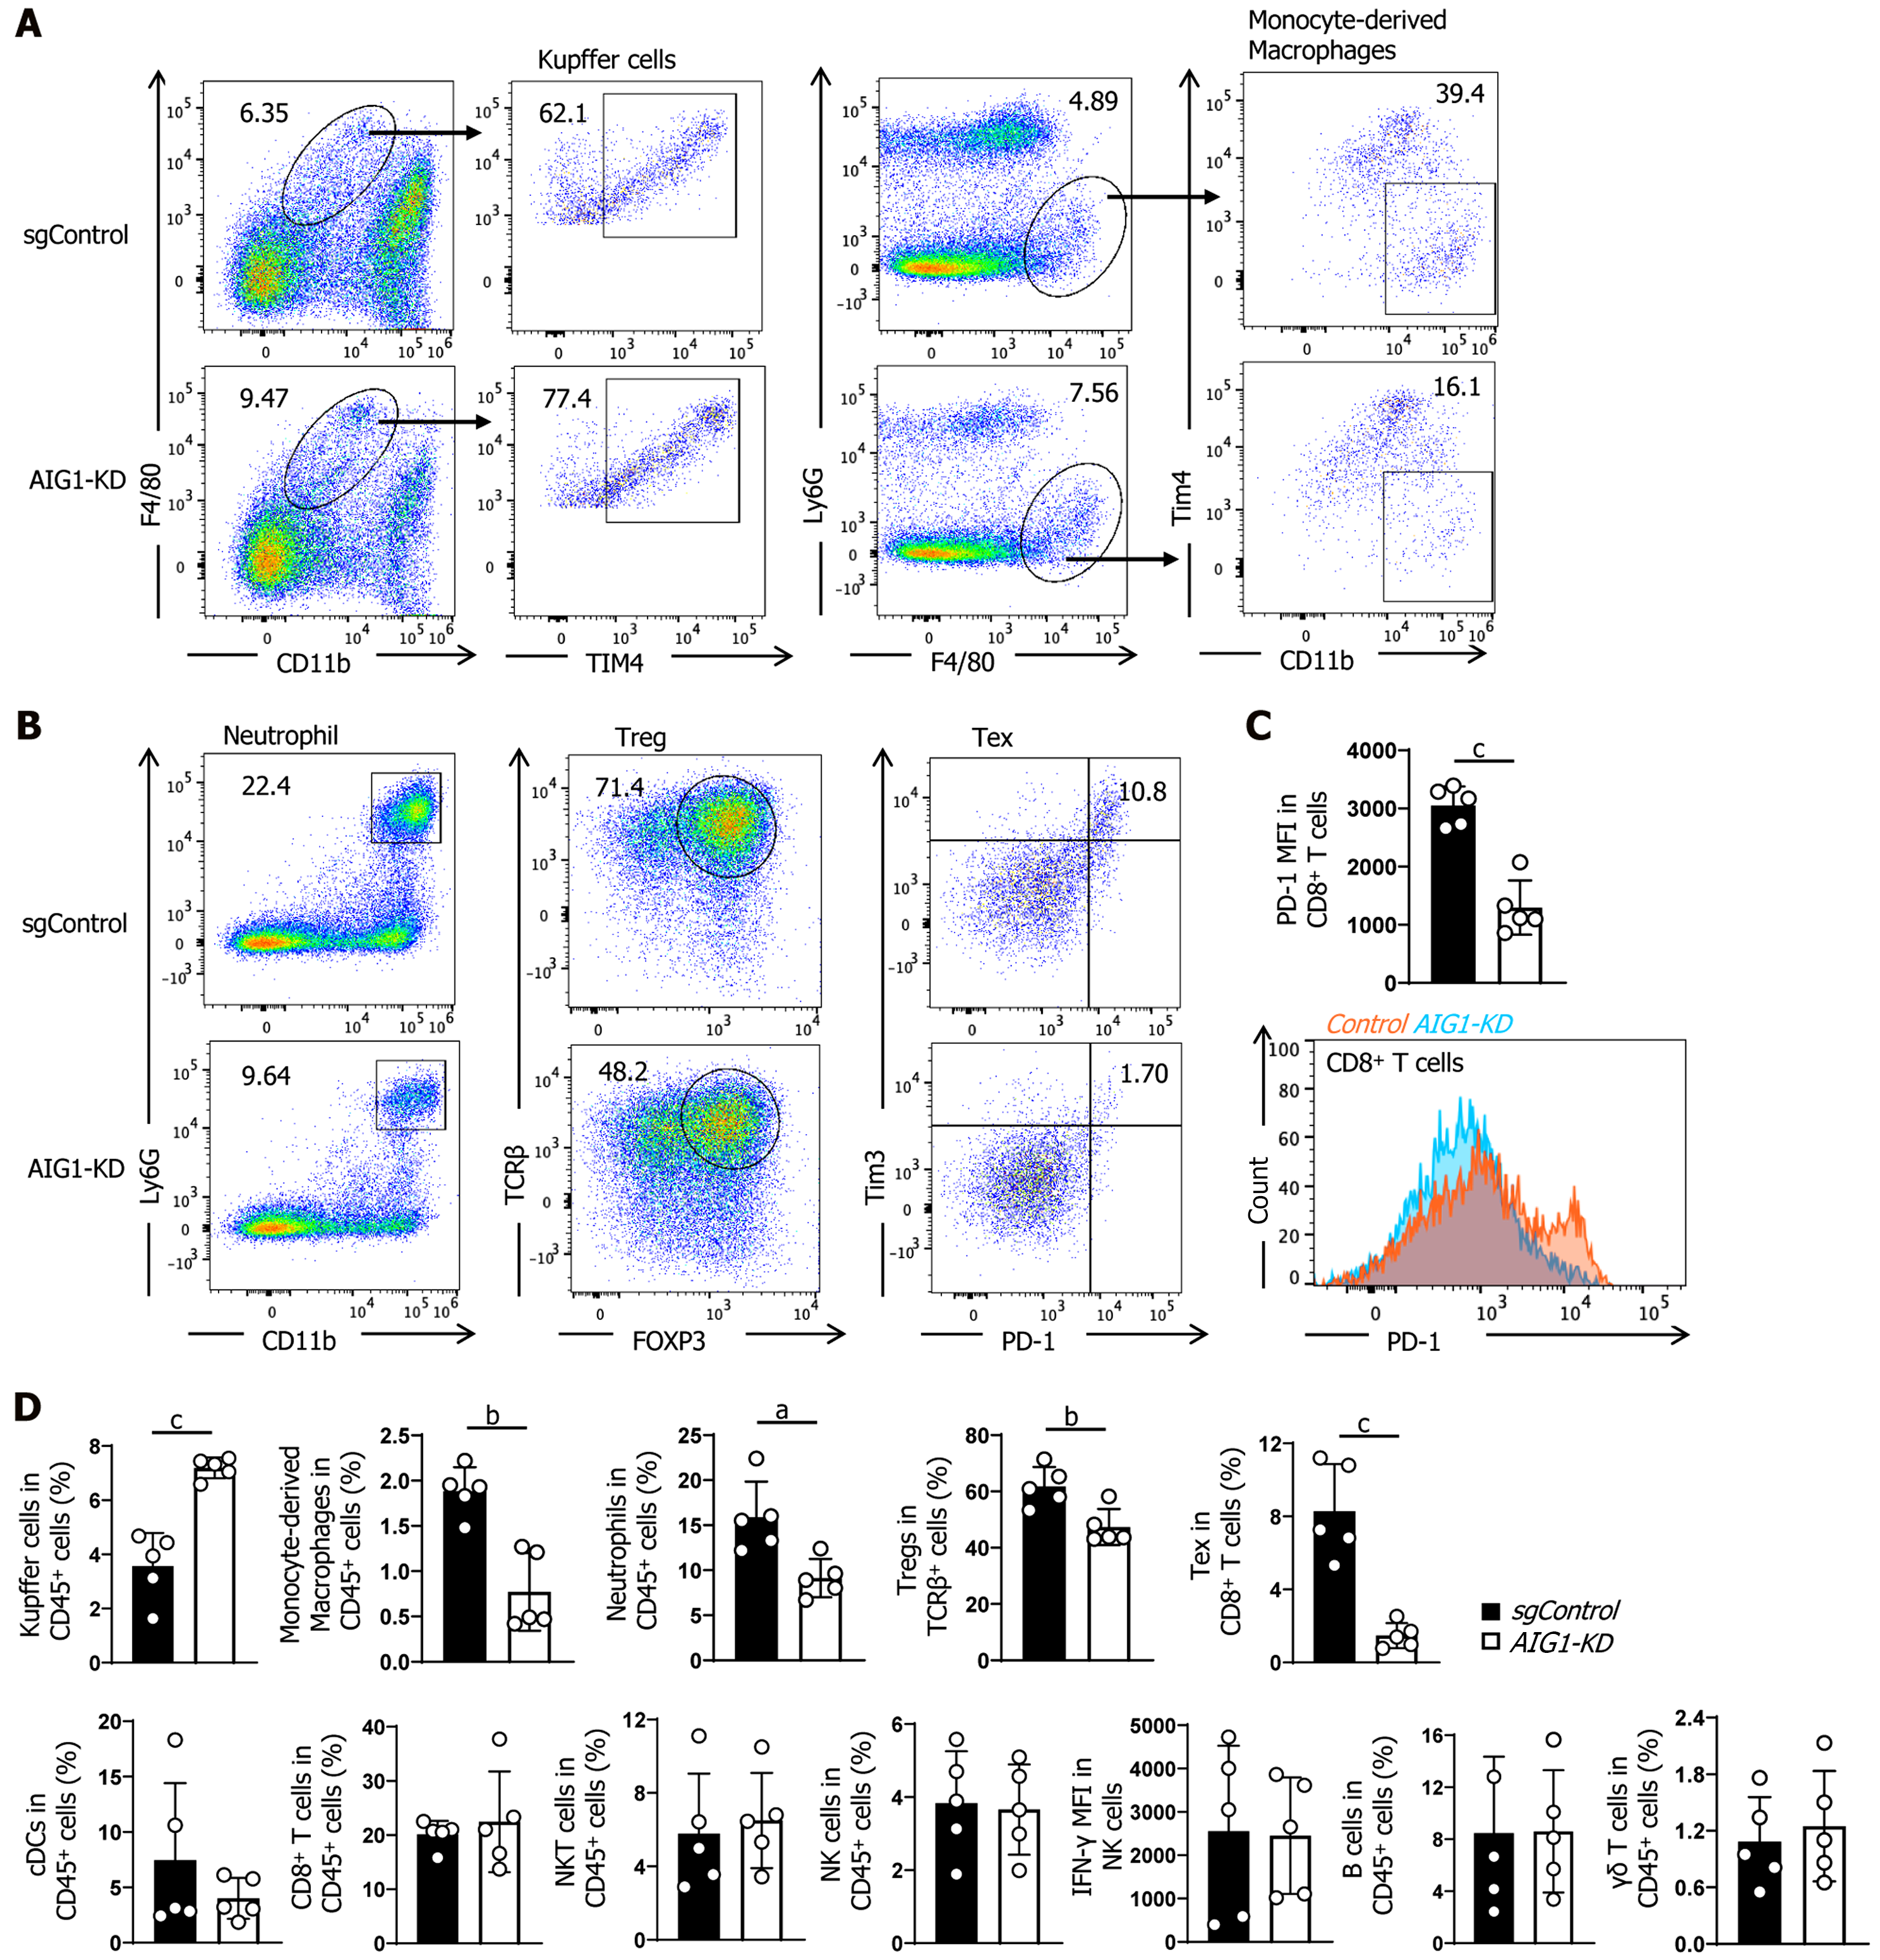
Figure 4 Androgen-induced gene 1 knockdown remodels the immune landscape in metastatic livers.
A: Flow cytometry dot plots showing Kupffer cells and monocyte-derived macrophages from non-targeting control single-guide RNA and androgen-induced gene 1 knockdown group; B: Flow cytometry dot plots showing neutrophils, regulatory T cells, and exhausted CD8+ T cells from on-targeting control single-guide RNA and androgen-induced gene 1 knockdown group; C: Quantification of programmed death-1 mean fluorescence intensity in CD8+ T cells. Representative histograms are shown below; D: Quantification of immune cell proportions, including Kupffer cells (P = 0.0002), monocyte-derived macrophages (P = 0.0012), neutrophils (P = 0.0101), regulatory T cells (percentage of T cell receptor β+ T cells; P = 0.0091), exhausted CD8+ T cells (P = 0.0005), and other indicated immune populations within the CD45+ compartment. Data are presented as mean ± SD. Each dot represents an individual mouse (n = 5 per group). Statistical significance was determined using unpaired t-test. aP < 0.05; bP < 0.01; cP < 0.001. sgControl: Non-targeting control single-guide RNA; AIG1-KD: Androgen-induced gene 1 knockdown; TIM4: T cell immunoglobulin and mucin domain-containing protein 4; FOXP3: Forkhead box P3; PD-1: Programmed death-1; Treg: Regulatory T cells; Tex: Exhausted CD8+ T cells; cDCs: Conventional dendritic cells; NKT: Natural killer T cells; NK: Natural killer cells; IFN: Interferon; MFI: Mean fluorescence intensity.
- Citation: Luo YZ, Zhao Q, Wang FF, Li JH, Lyu SC, Liu Z, Lang R, He Q. Androgen-induced gene 1 correlates with extracellular vesicle-associated cholesterol metabolism and hepatic metastasis of pancreatic cancer. World J Gastroenterol 2026; 32(39): 121007
- URL: https://www.wjgnet.com/1007-9327/full/v32/i39/121007.htm
- DOI: https://dx.doi.org/10.3748/wjg.121007