
















Copyright: ©Author(s) 2026.
World J Gastroenterol. Oct 14, 2026; 32(38): 121425
Published online Oct 14, 2026. doi: 10.3748/wjg.121425
Published online Oct 14, 2026. doi: 10.3748/wjg.121425
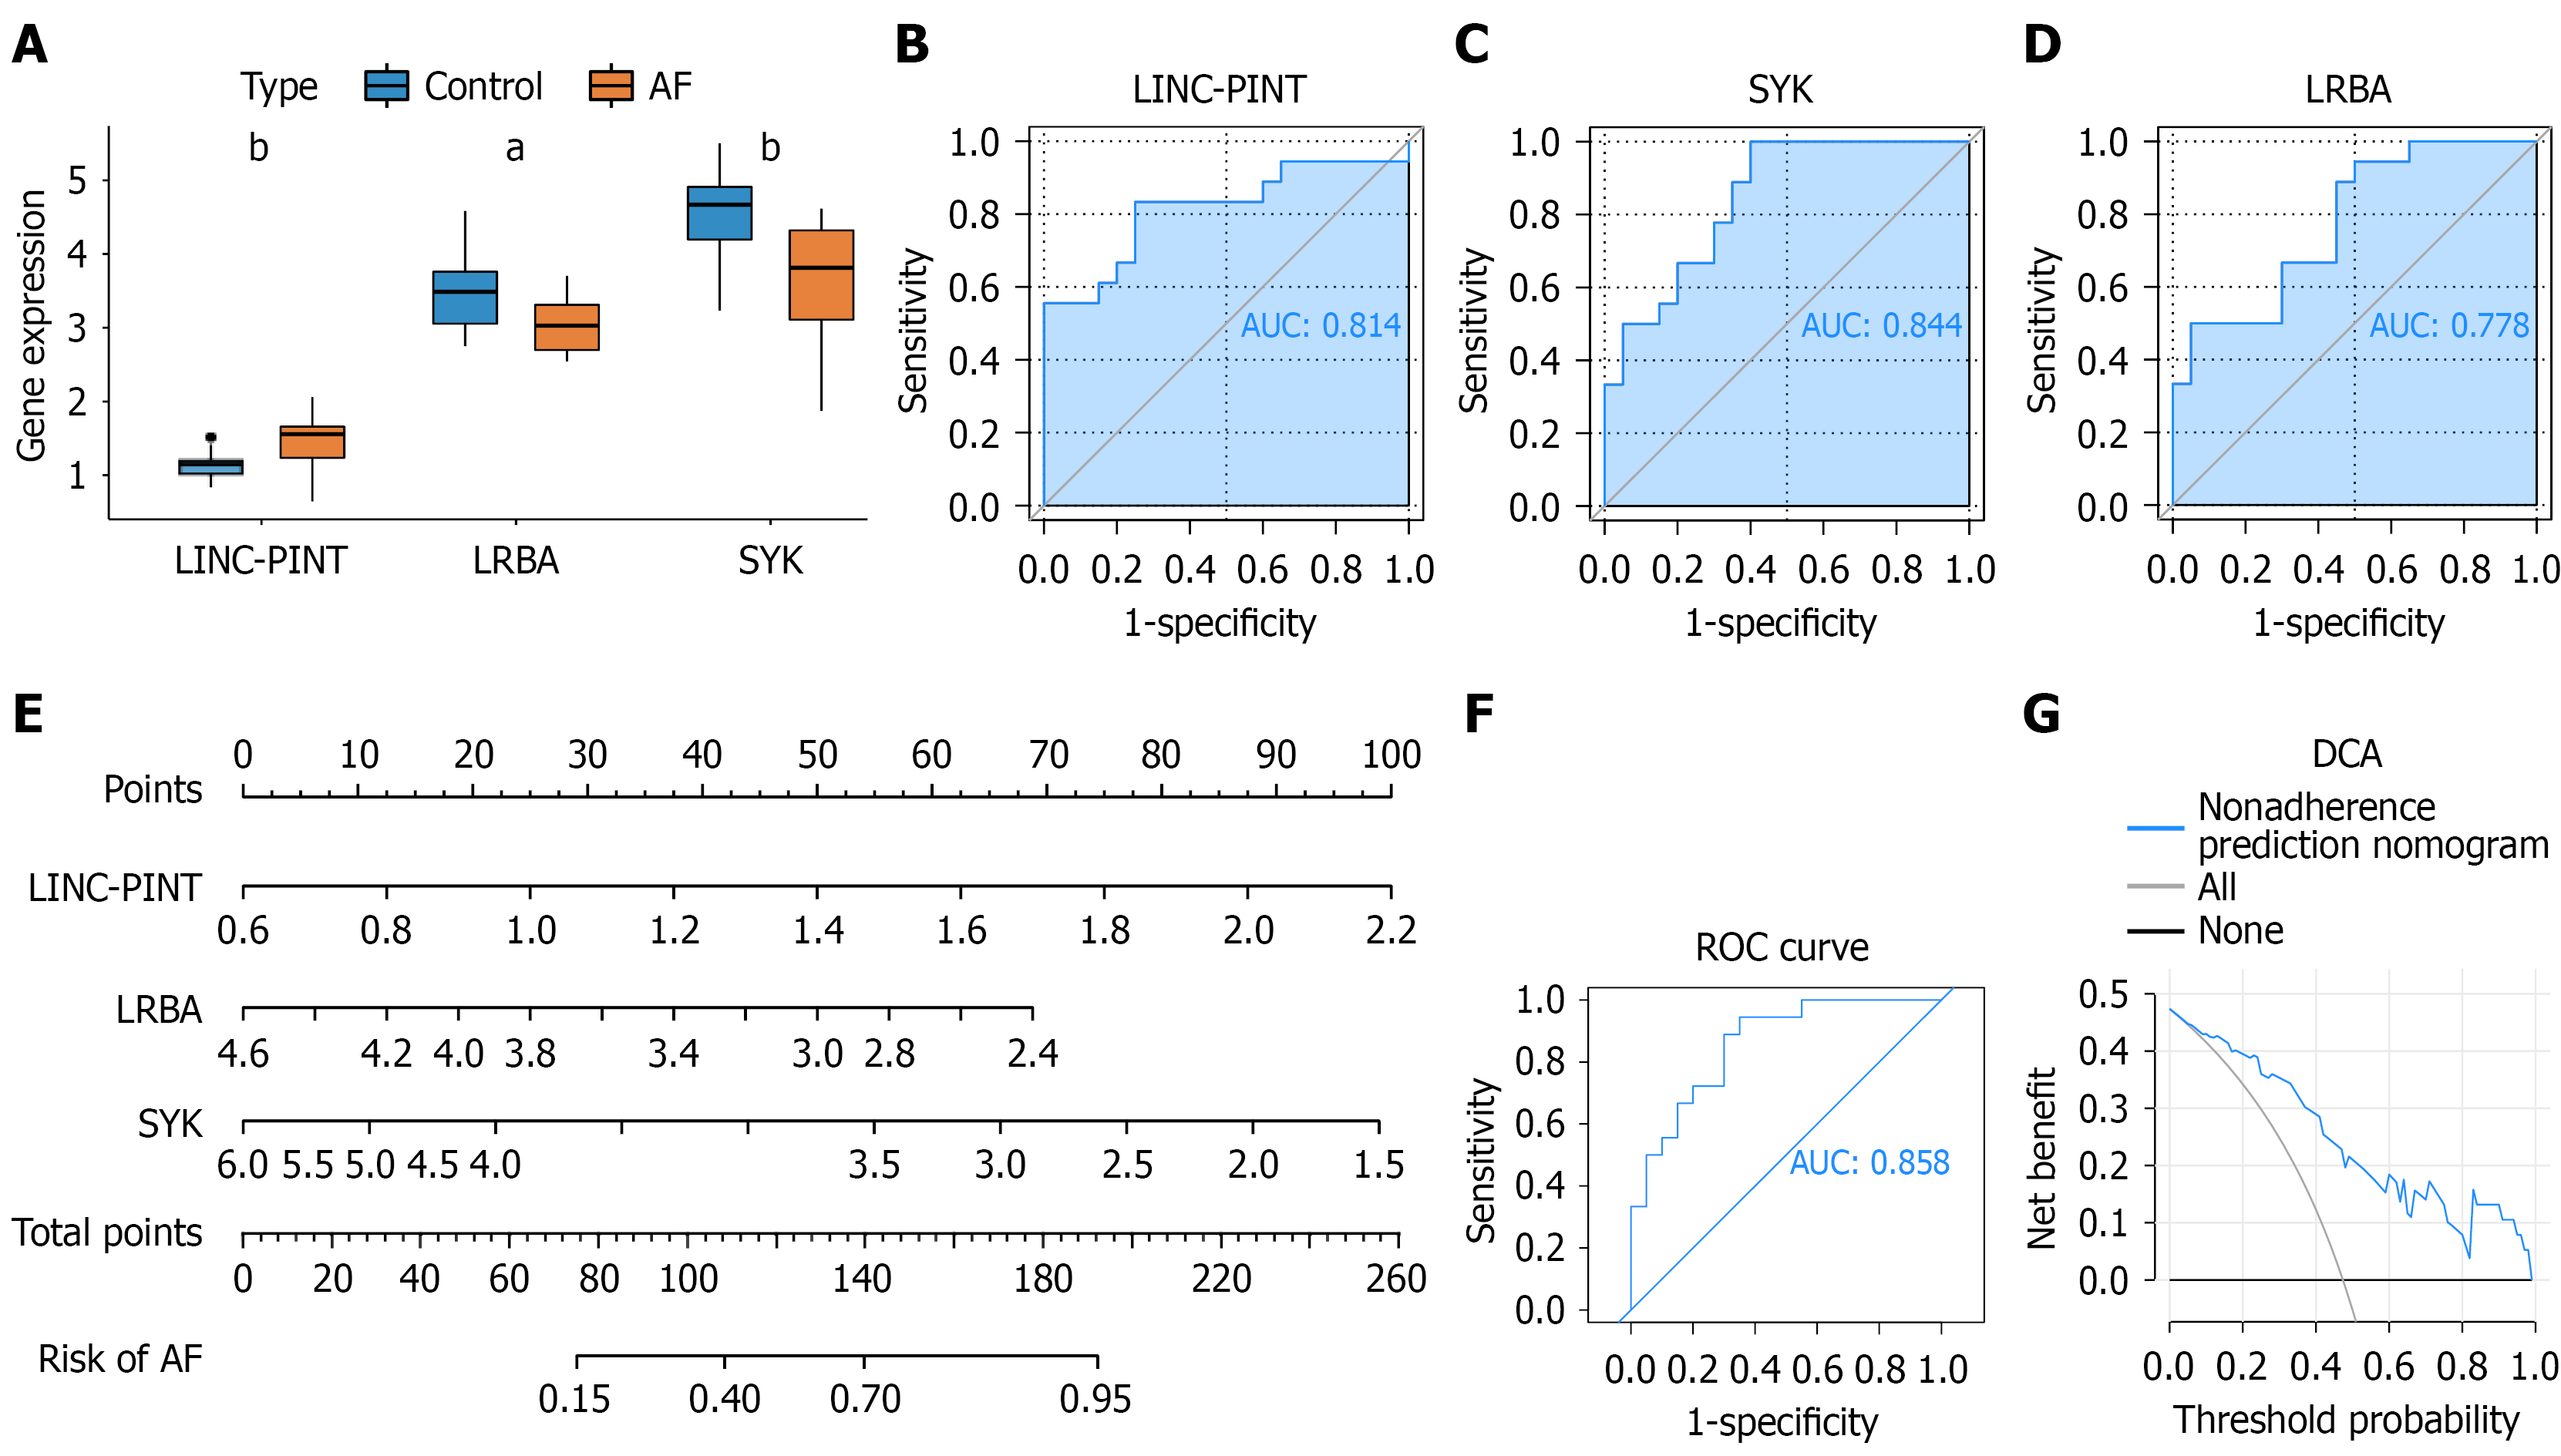
Figure 7 Diagnostic performance and predictive model construction based on LINC-PINT, LRBA, and SYK.
A: Box plot showing the expression levels of LINC-PINT, LRBA, and SYK in anal fistula (AF) vs control group. LINC-PINT showed significantly higher expression in the AF group; B-D: Receiver operating characteristic (ROC) curves evaluating the diagnostic performance of individual genes: LINC-PINT [area under the ROC curves (AUC)= 0.814], SYK (AUC = 0.844), and LRBA (AUC = 0.778); E: Nomogram constructed using LINC-PINT, LRBA, and SYK to predict AF risk; F: ROC curve evaluating the combined predictive model, showing strong discrimination ability; G: Decision curve analysis indicating favorable clinical utility of the nomogram-based prediction model. aP < 0.01; bP < 0.001. AF: Anal fistula; ROC: Receiver operating characteristic; AUC: Area under the receiver operating characteristic curve; DCA: Decision curve analysis.
- Citation: Li TT, Li JN, Yang HW, Dou XY, Jiang L, Lai LX, Yu Q, Chen XY, Wang Y, Zhang XC, Ma HF, Song XB. Single-cell and bulk transcriptomics with machine learning decode B cell hub genes and diagnostic biomarkers in anal fistula. World J Gastroenterol 2026; 32(38): 121425
- URL: https://www.wjgnet.com/1007-9327/full/v32/i38/121425.htm
- DOI: https://dx.doi.org/10.3748/wjg.121425