
















Copyright: ©Author(s) 2026.
World J Gastroenterol. Oct 14, 2026; 32(38): 121425
Published online Oct 14, 2026. doi: 10.3748/wjg.121425
Published online Oct 14, 2026. doi: 10.3748/wjg.121425
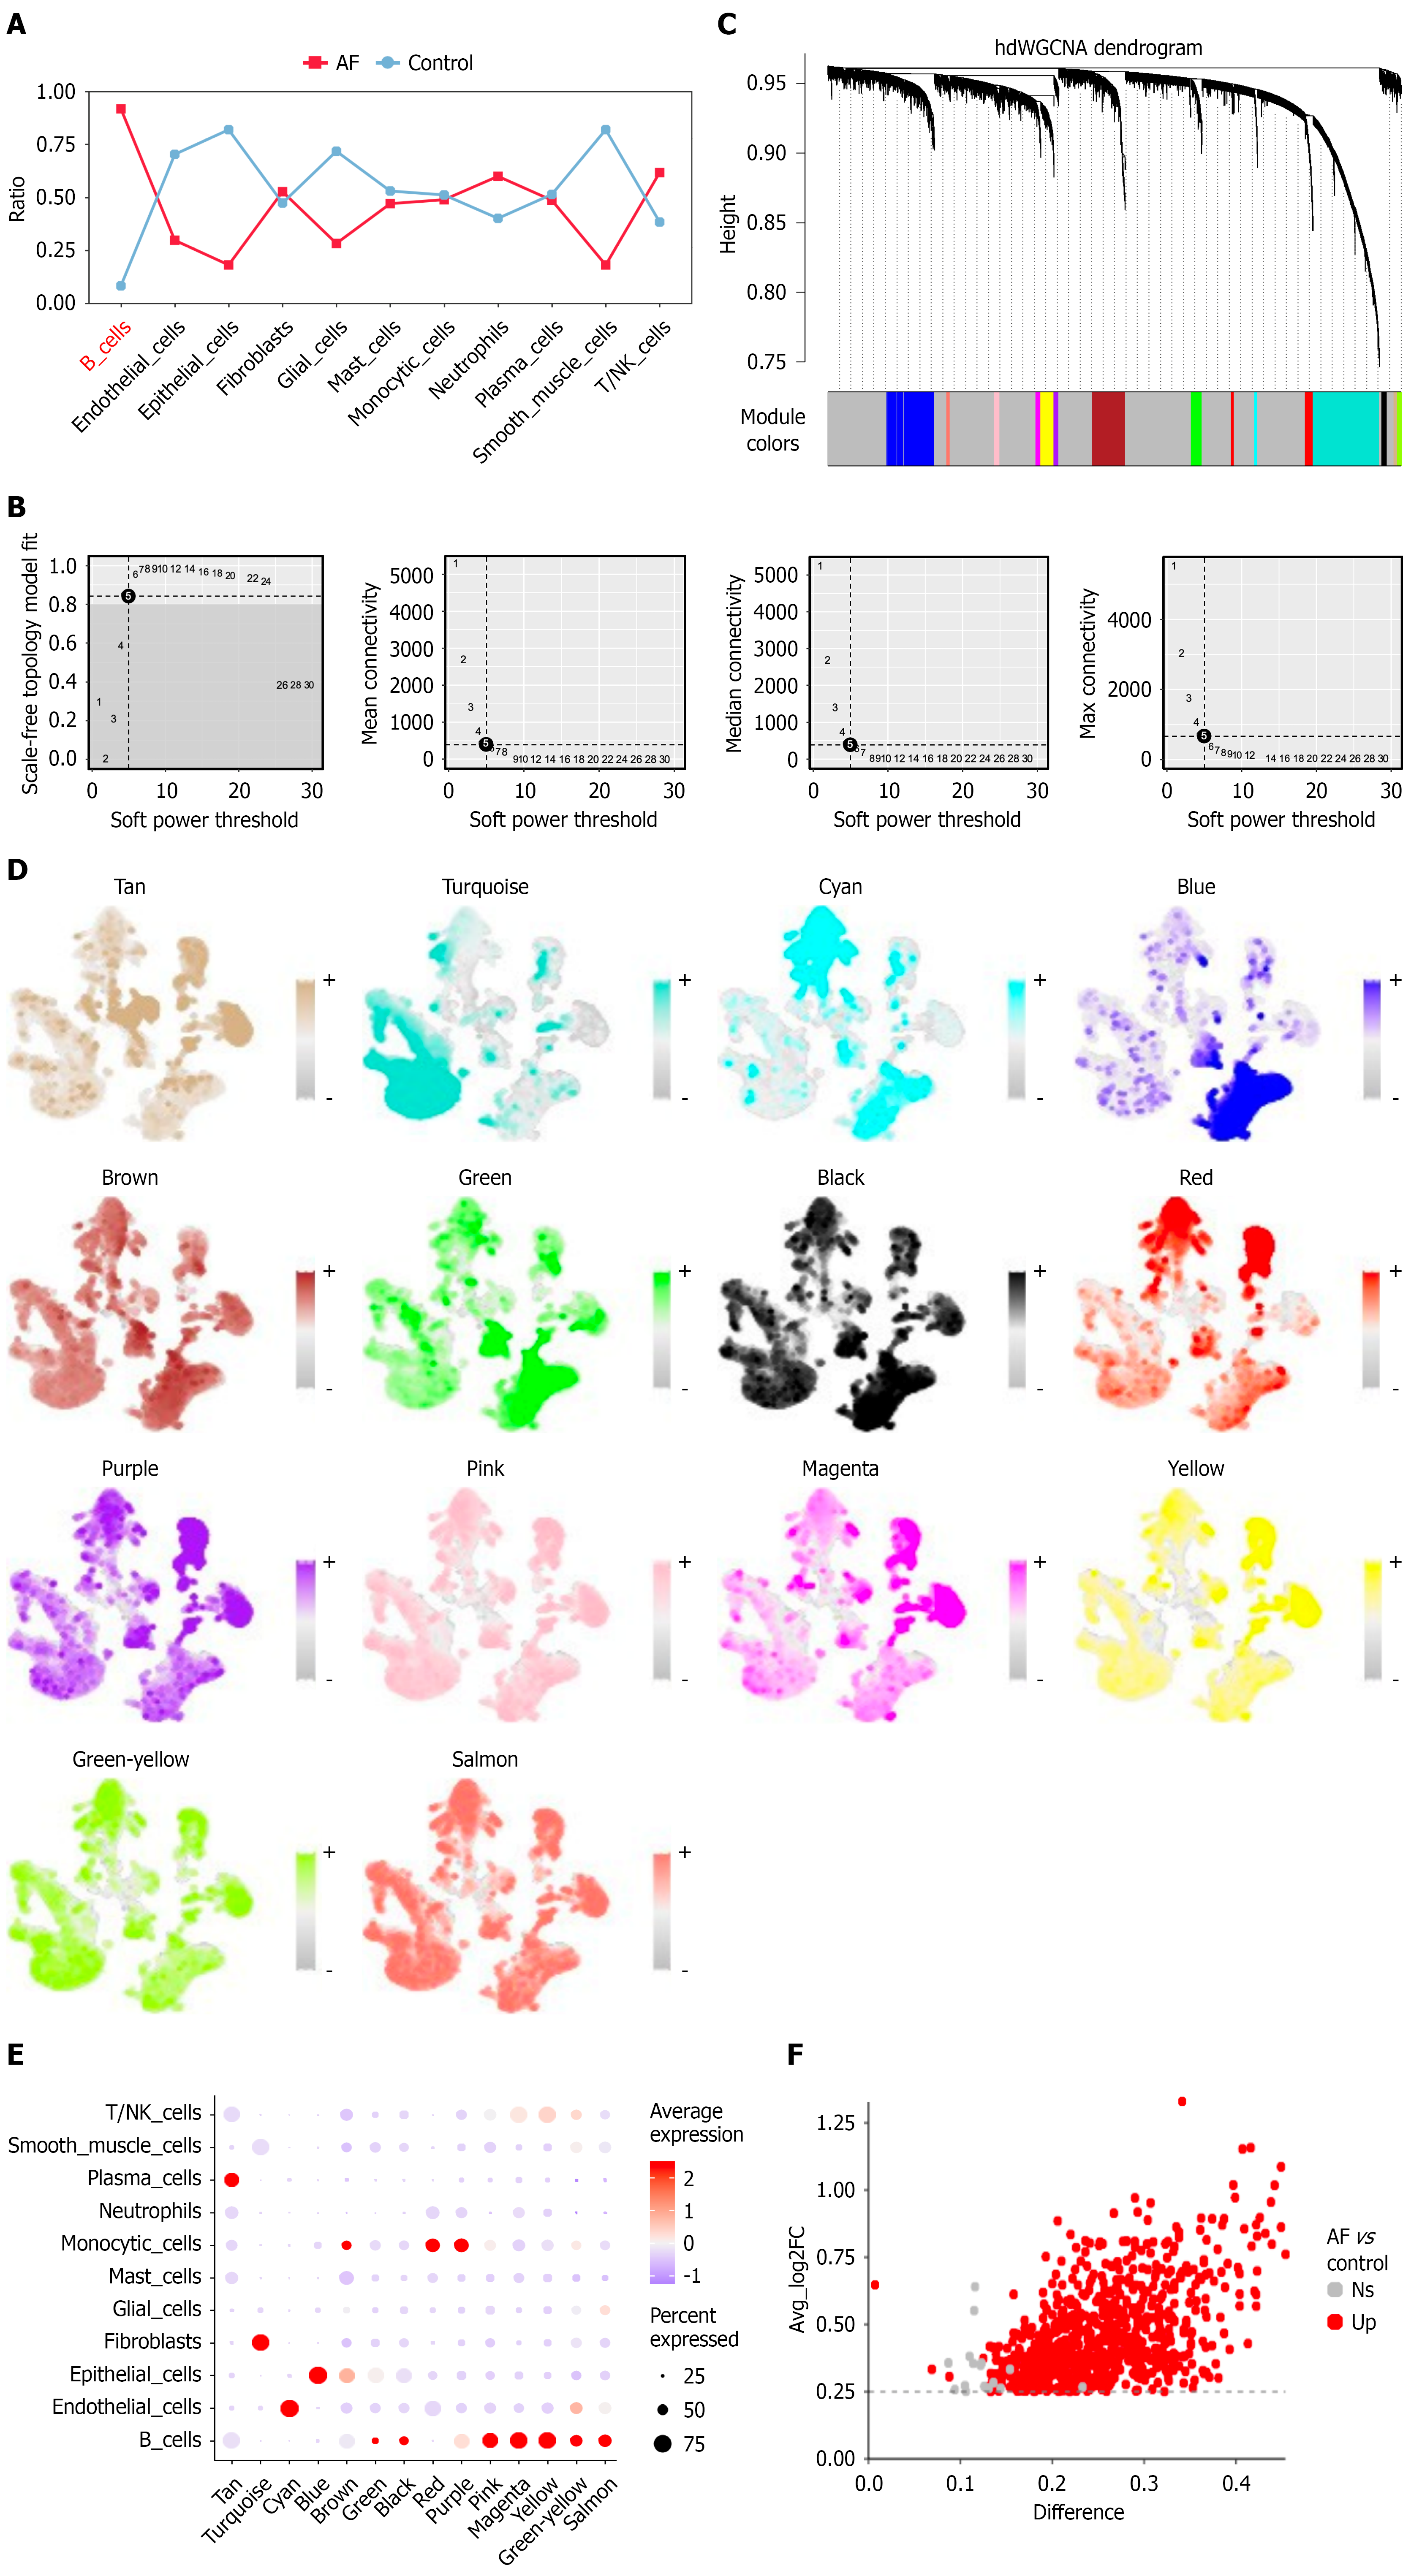
Figure 3 B cell-specific differences and co-expression modules in anal fistula vs control.
A: Line plot showing the distribution of 11 major cell types across anal fistula (AF) and control samples. B cells exhibited the largest difference and were markedly elevated in the AF group; B: Determination of soft-thresholding power in high-dimensional weighted gene co-expression network analysis (hdWGCNA); C: Dendrogram of gene modules identified by hdWGCNA, revealing 14 co-expression modules in B cells; D: Uniform manifold approximation and projection visualization of module gene expression patterns across cells, colored by different module identities; E: Dot plot showing the expression levels of genes from each module across different cell types. Green, black, pink, magenta, yellow, green-yellow, and salmon modules were enriched in B cells; F: Volcano plot showing differentially expressed genes in B cells between AF and control groups. A total of 764 genes were significantly upregulated in the AF group. AF: Anal fistula; hdWGCNA: High-dimensional weighted gene co-expression network analysis.
- Citation: Li TT, Li JN, Yang HW, Dou XY, Jiang L, Lai LX, Yu Q, Chen XY, Wang Y, Zhang XC, Ma HF, Song XB. Single-cell and bulk transcriptomics with machine learning decode B cell hub genes and diagnostic biomarkers in anal fistula. World J Gastroenterol 2026; 32(38): 121425
- URL: https://www.wjgnet.com/1007-9327/full/v32/i38/121425.htm
- DOI: https://dx.doi.org/10.3748/wjg.121425