
















Copyright: ©Author(s) 2026.
World J Gastroenterol. Oct 14, 2026; 32(38): 121425
Published online Oct 14, 2026. doi: 10.3748/wjg.121425
Published online Oct 14, 2026. doi: 10.3748/wjg.121425
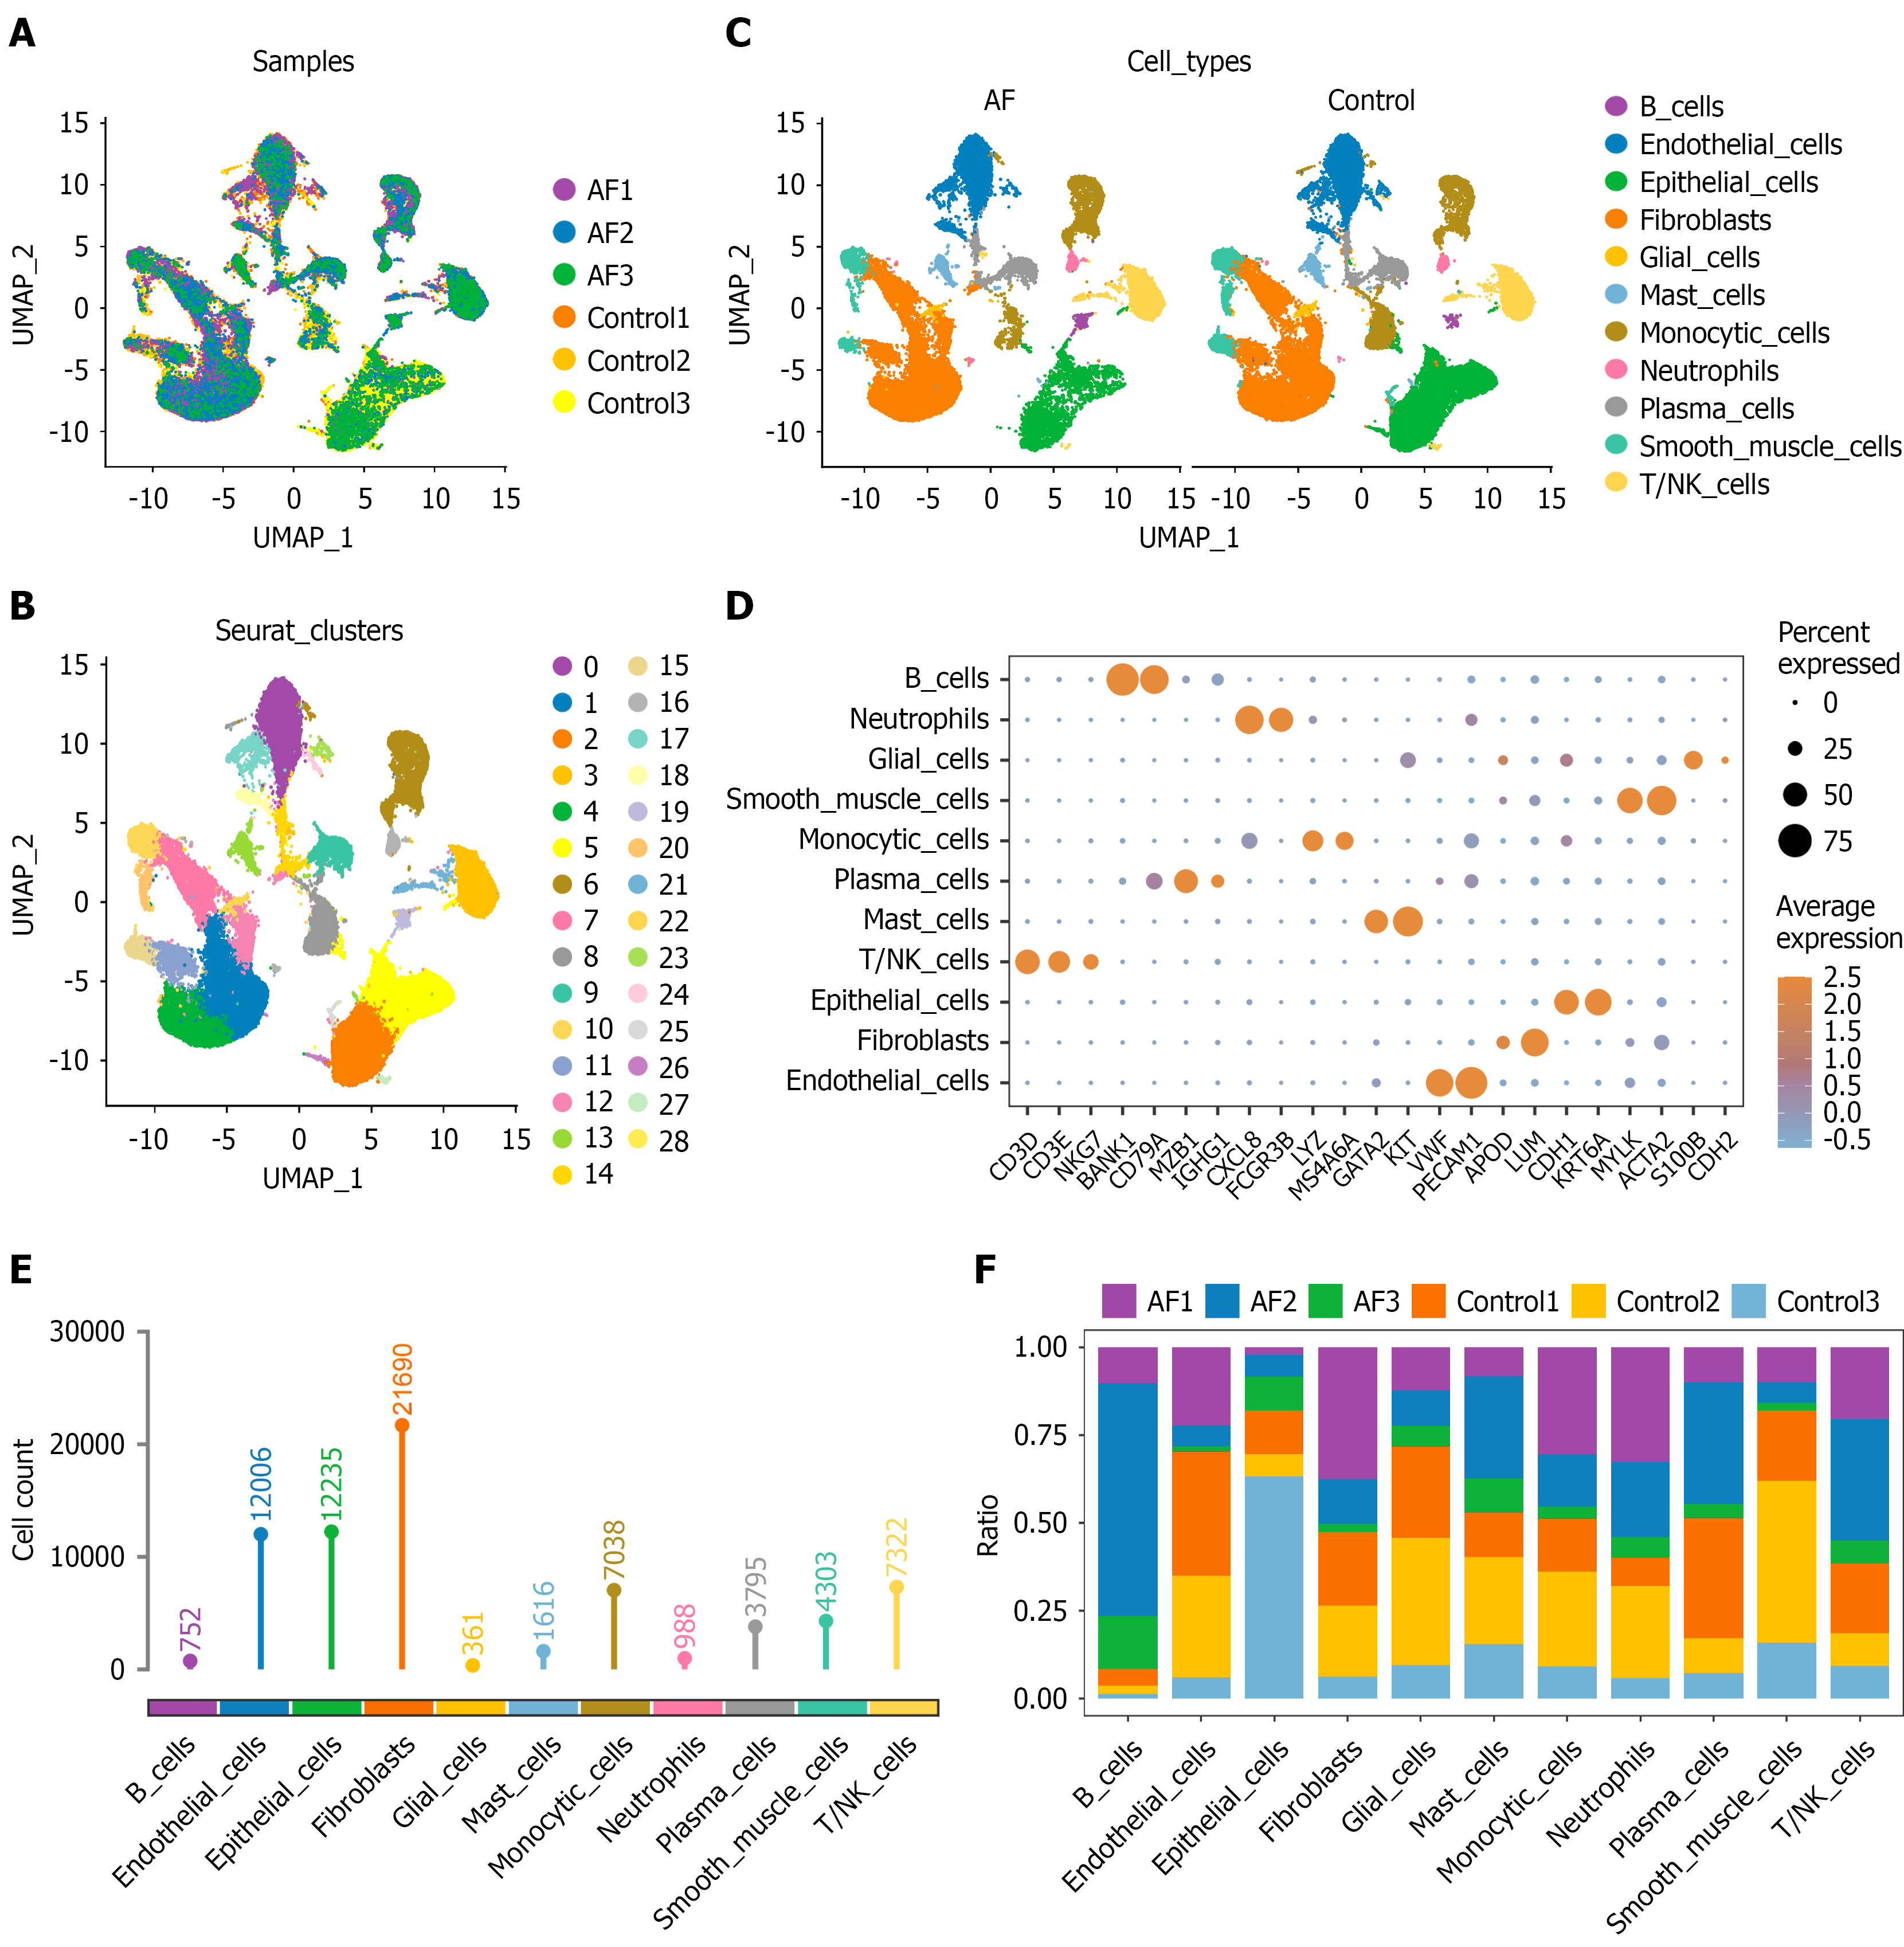
Figure 2 Single-cell transcriptomic landscape of anal fistula and control samples.
A: Uniform manifold approximation and projection (UMAP) plot showing the clustering of all single cells into 29 distinct Seurat clusters; B: UMAP visualization colored by samples, including anal fistula (AF) and control samples; C: UMAP plot of annotated major cell types across AF and control groups; D: Dot plot displaying the expression of canonical marker genes used to define 11 major cell types. The size of the dots represents the percentage of cells expressing each gene, and the color indicates the average expression level; E: Bar plot showing the absolute number of cells for each of the 11 major cell types; F: Proportional distribution of the 11 major cell types across all six samples. UMAP: Uniform manifold approximation and projection; AF: Anal fistula.
- Citation: Li TT, Li JN, Yang HW, Dou XY, Jiang L, Lai LX, Yu Q, Chen XY, Wang Y, Zhang XC, Ma HF, Song XB. Single-cell and bulk transcriptomics with machine learning decode B cell hub genes and diagnostic biomarkers in anal fistula. World J Gastroenterol 2026; 32(38): 121425
- URL: https://www.wjgnet.com/1007-9327/full/v32/i38/121425.htm
- DOI: https://dx.doi.org/10.3748/wjg.121425