
















Copyright: ©Author(s) 2026.
World J Gastroenterol. Oct 14, 2026; 32(38): 120967
Published online Oct 14, 2026. doi: 10.3748/wjg.120967
Published online Oct 14, 2026. doi: 10.3748/wjg.120967
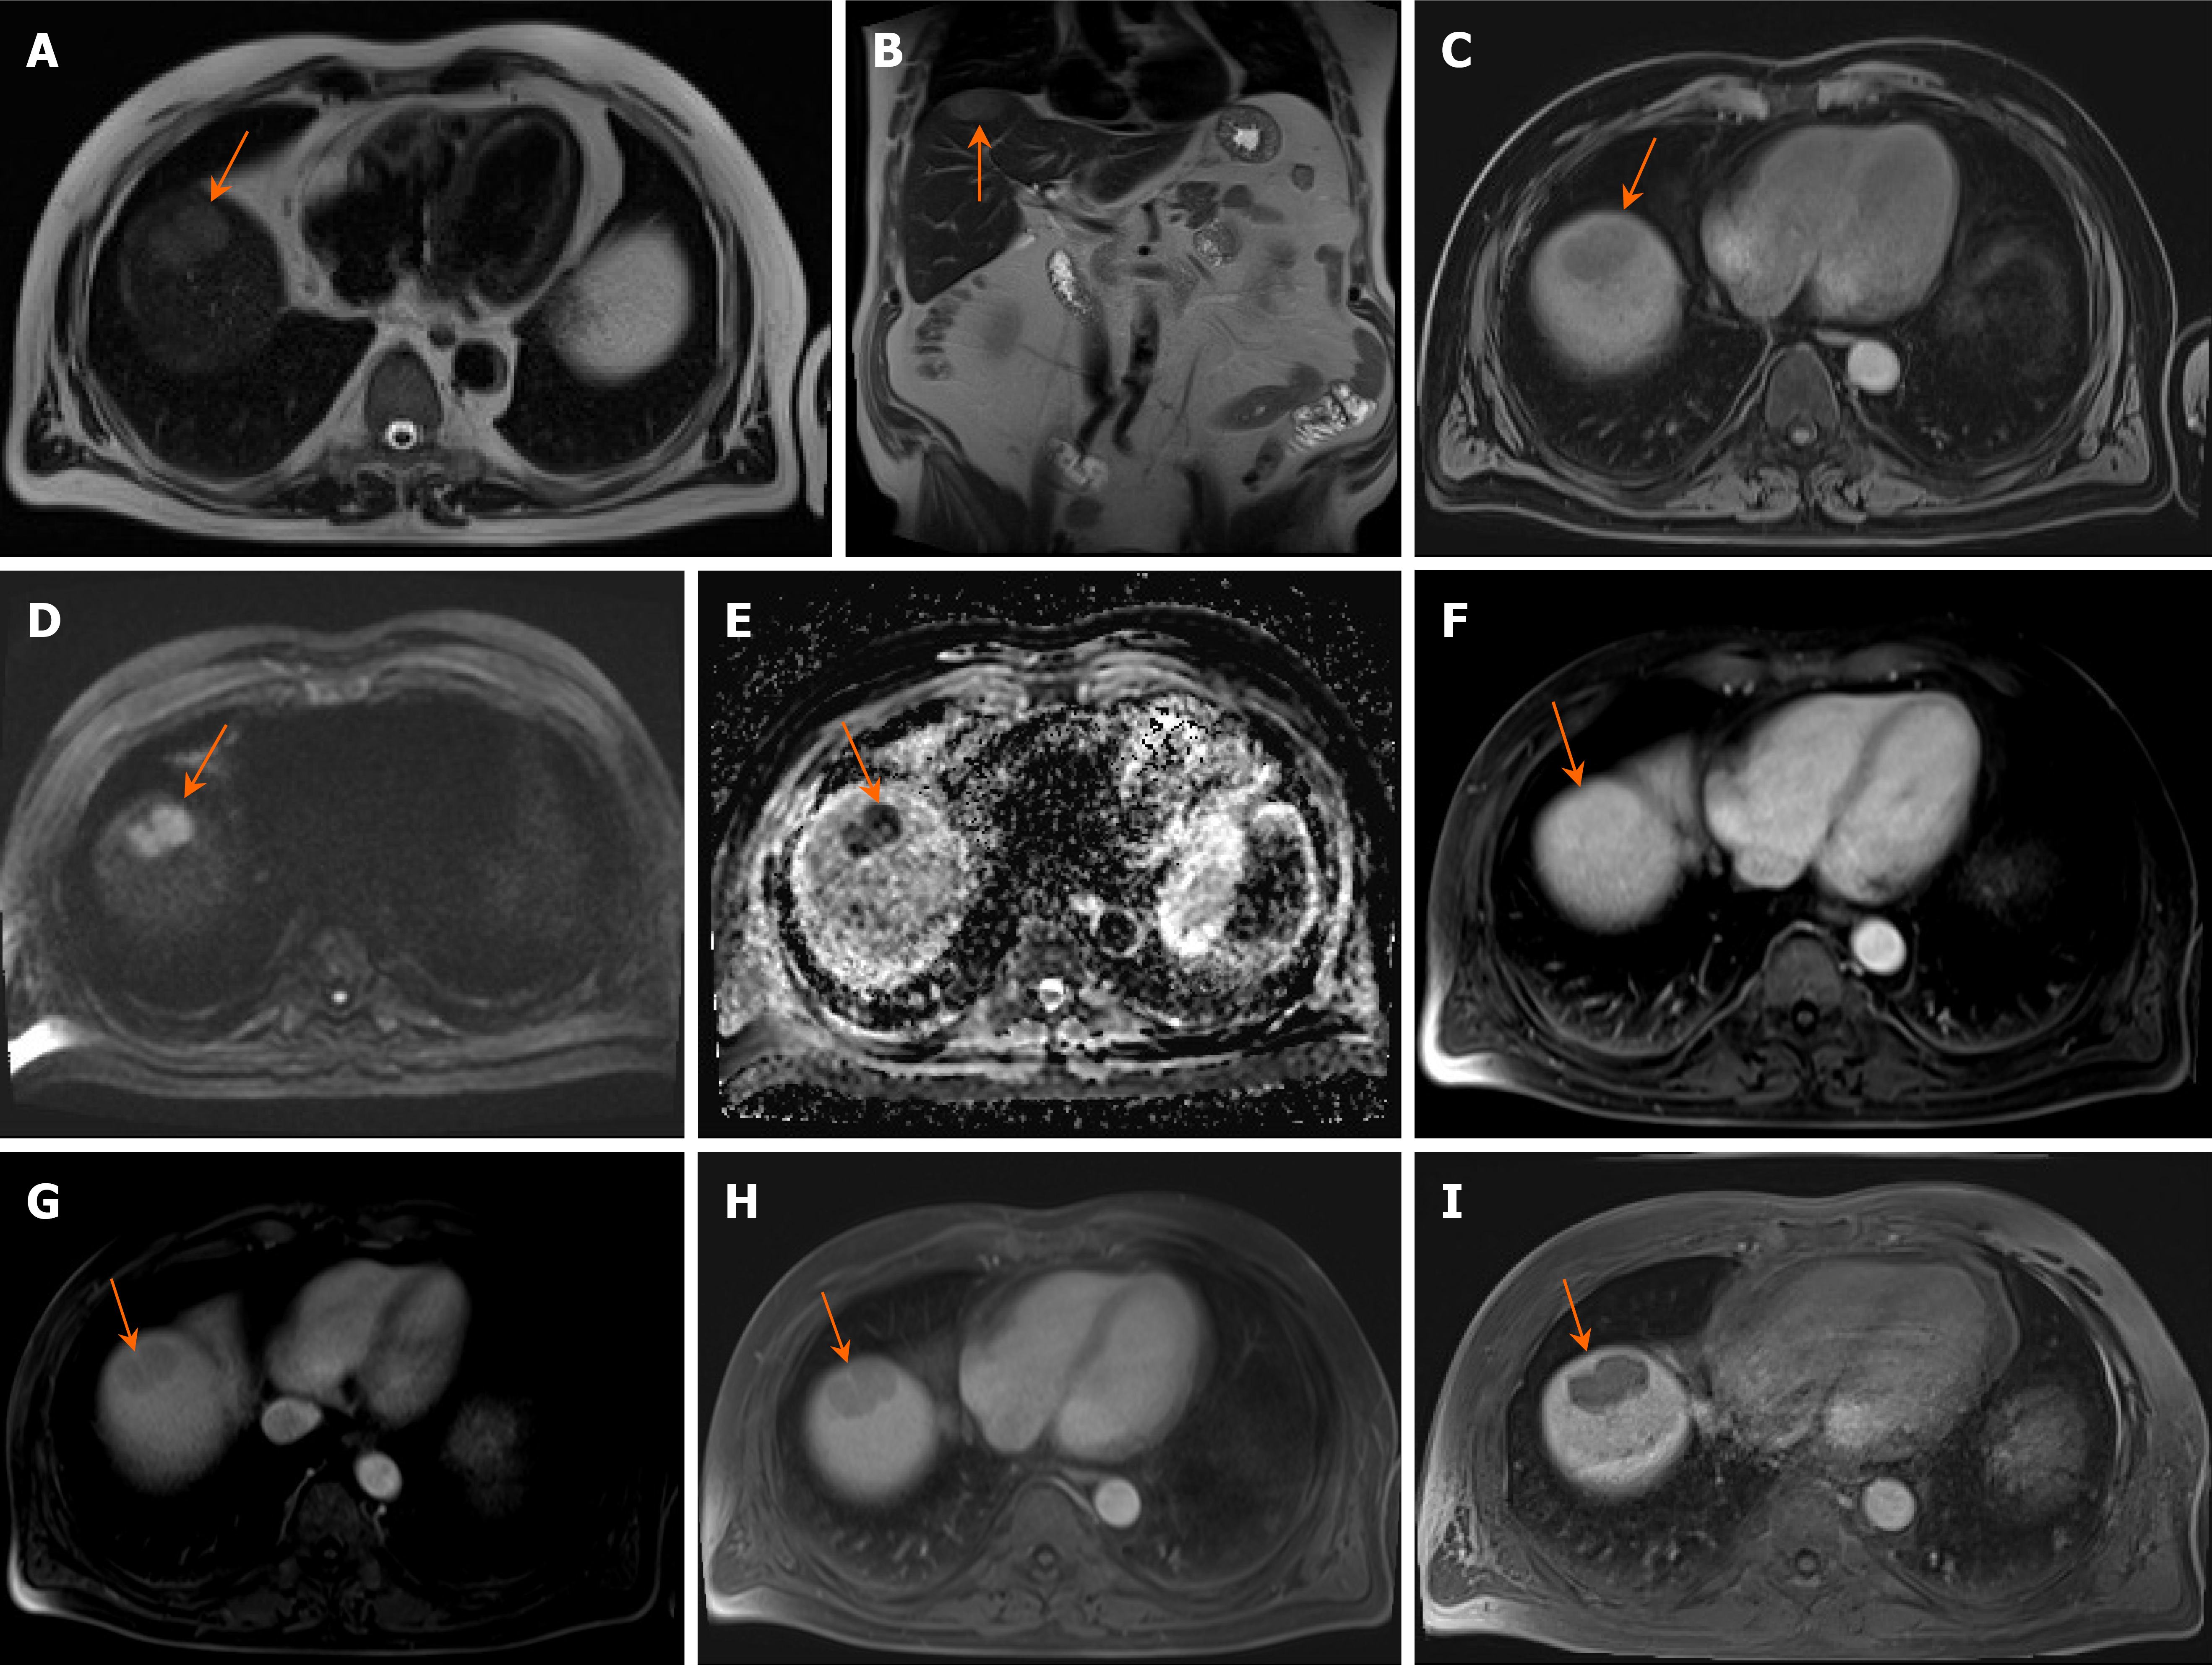
Figure 1 Magnetic resonance imaging findings of the patient.
A and B: T2-weighted axial (A) and coronal (B) slices show a slightly hyperintense lobulated lesion measuring 25 mm × 37 mm in segment VIII of the liver (arrow); C: T1-weighted image with fat suppression shows a slightly hypointense lobulated lesion in segment VIII (arrow); D: Diffusion-weighted imaging demonstrates marked hyperintensity of the lesion (arrow); E: Apparent diffusion coefficient map shows low signal intensity (arrow); F: Arterial-phase T1-weighted axial slice shows mild hypervascularity of the lesion compared with the surrounding liver parenchyma (arrow); G-I: A prominent wash-out pattern is demonstrated on the portal-venous (G), 3-minute (H), and 10-minute (I) delayed phase (arrow).
- Citation: Sikiric M, Premec H, Mijic M, Sobocan N, Filipec Kanizaj T, Lovric E, Kavur L, Lalovac M. Diagnostic challenge of intrahepatic splenosis masquerading as hepatocellular carcinoma: A case report and review of literature. World J Gastroenterol 2026; 32(38): 120967
- URL: https://www.wjgnet.com/1007-9327/full/v32/i38/120967.htm
- DOI: https://dx.doi.org/10.3748/wjg.120967