
















Copyright: ©Author(s) 2026.
World J Gastroenterol. Sep 21, 2026; 32(35): 119277
Published online Sep 21, 2026. doi: 10.3748/wjg.119277
Published online Sep 21, 2026. doi: 10.3748/wjg.119277
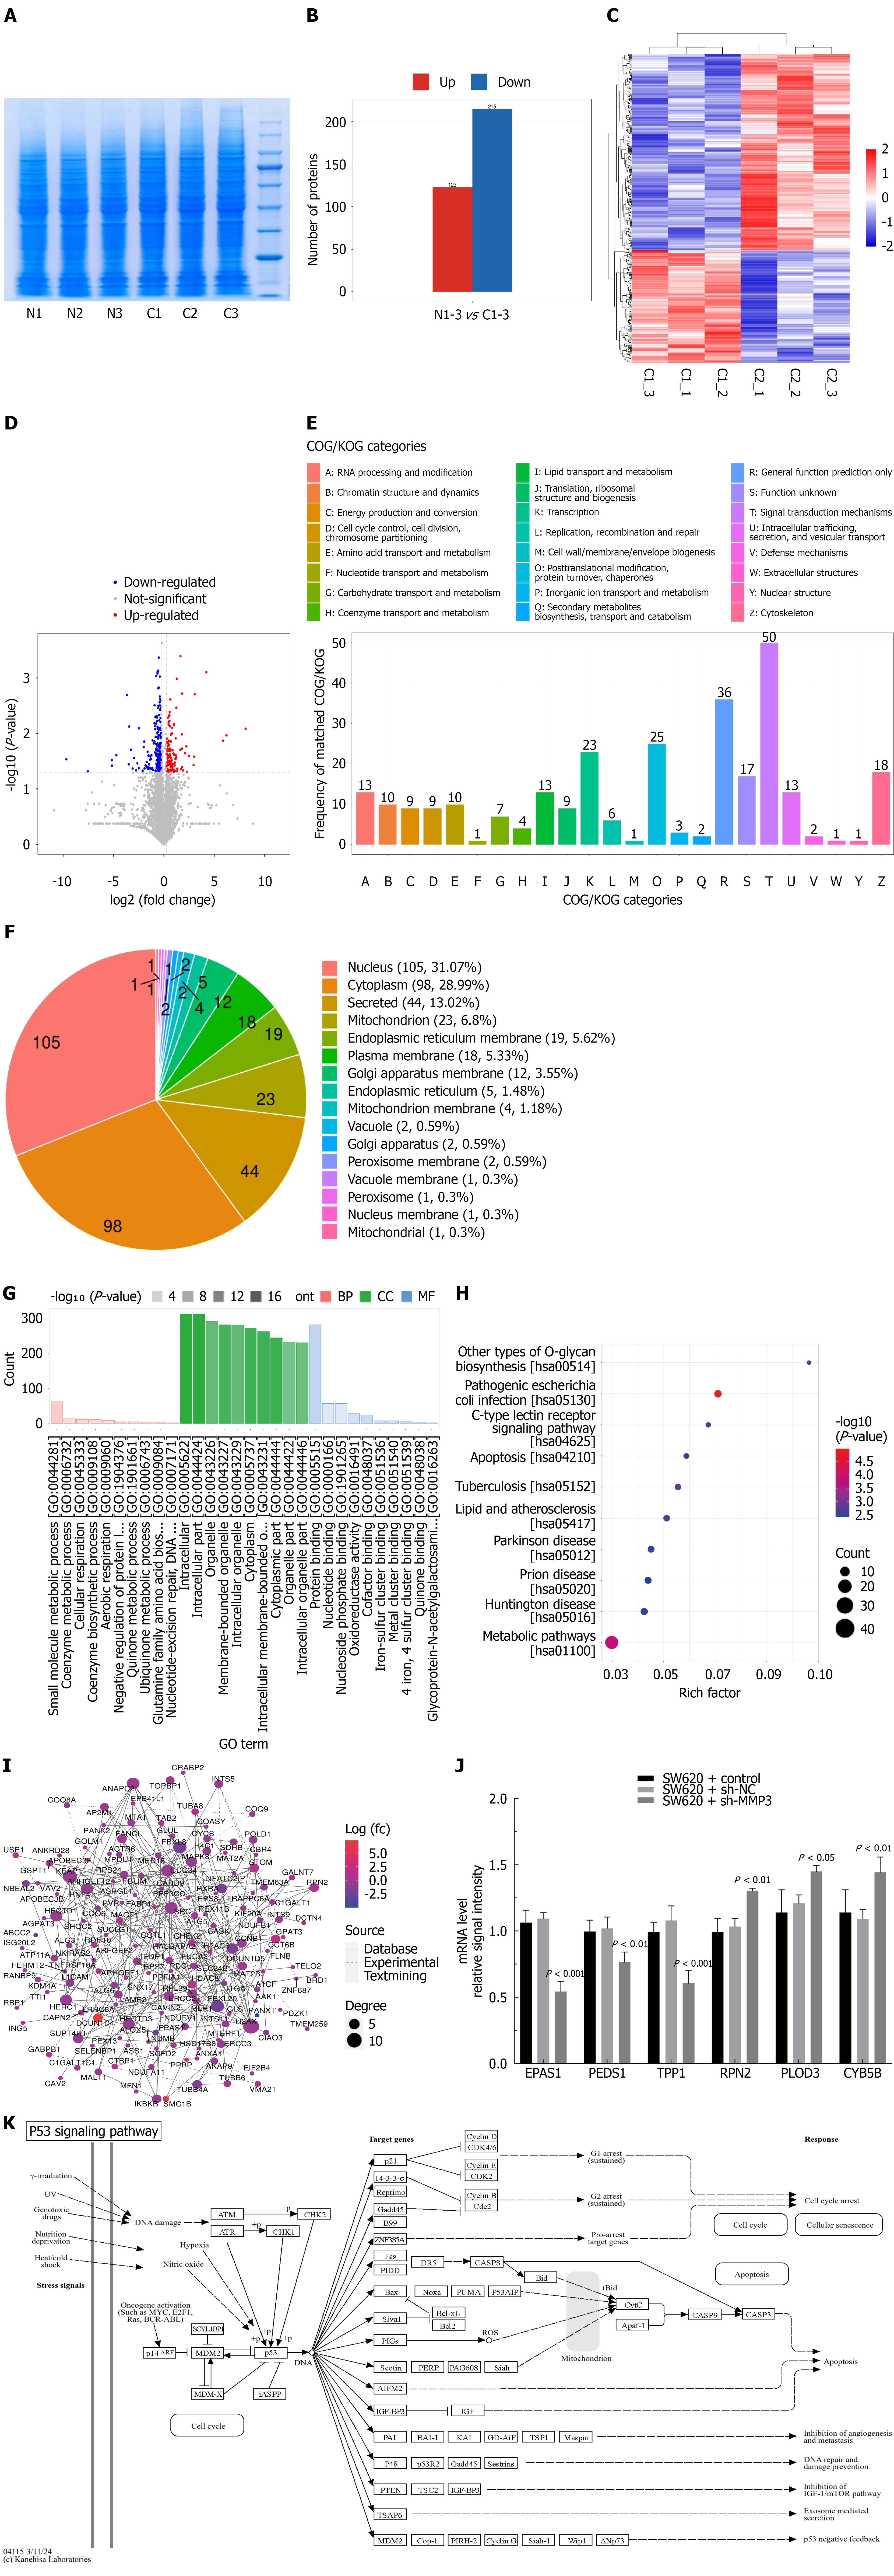
Figure 3 Proteomic analysis identifies endothelial PAS domain protein 1 as a downstream target of matrix metalloproteinase 3 in colorectal cancer.
A: SDS-PAGE and Coomassie Brilliant Blue staining to evaluate protein integrity in colorectal cancer (CRC) cell lines; B: Bar graph depicting the distribution of differentially expressed proteins (DEPs) across various comparison groups; C: Hierarchical clustering of DEPs, revealing distinct expression patterns in CRC cells; D: Volcano plot showing DEPs between MMP3 siRNA and control groups, highlighting key proteins such as endothelial PAS domain protein 1 (EPAS1); E: Bar chart of Cluster of Orthologous Groups analysis for DEPs; F: Pie chart illustrating the subcellular localization of DEPs; G: Gene ontology enrichment analysis of DEPs, identifying key biological processes; H: Bubble plot displaying Kyoto Encyclopedia of Genes and Genomes pathway enrichment analysis of DEPs; I: PPI network for DEPs, identifying key protein interactions; J: Quantitative real-time-PCR validation of EPAS1 expression in MMP3-knockdown CRC cells; K: Protein interaction network within the P53 signaling pathway involving EPAS1.
- Citation: Du BB, Qian ZP, Zhu CZ, Guan QL. Matrix metalloproteinase 3 facilitates colorectal cancer progression by enhancing cell proliferation and invasion. World J Gastroenterol 2026; 32(35): 119277
- URL: https://www.wjgnet.com/1007-9327/full/v32/i35/119277.htm
- DOI: https://dx.doi.org/10.3748/wjg.119277