
















Copyright: ©Author(s) 2026.
World J Gastroenterol. Sep 14, 2026; 32(34): 119523
Published online Sep 14, 2026. doi: 10.3748/wjg.119523
Published online Sep 14, 2026. doi: 10.3748/wjg.119523
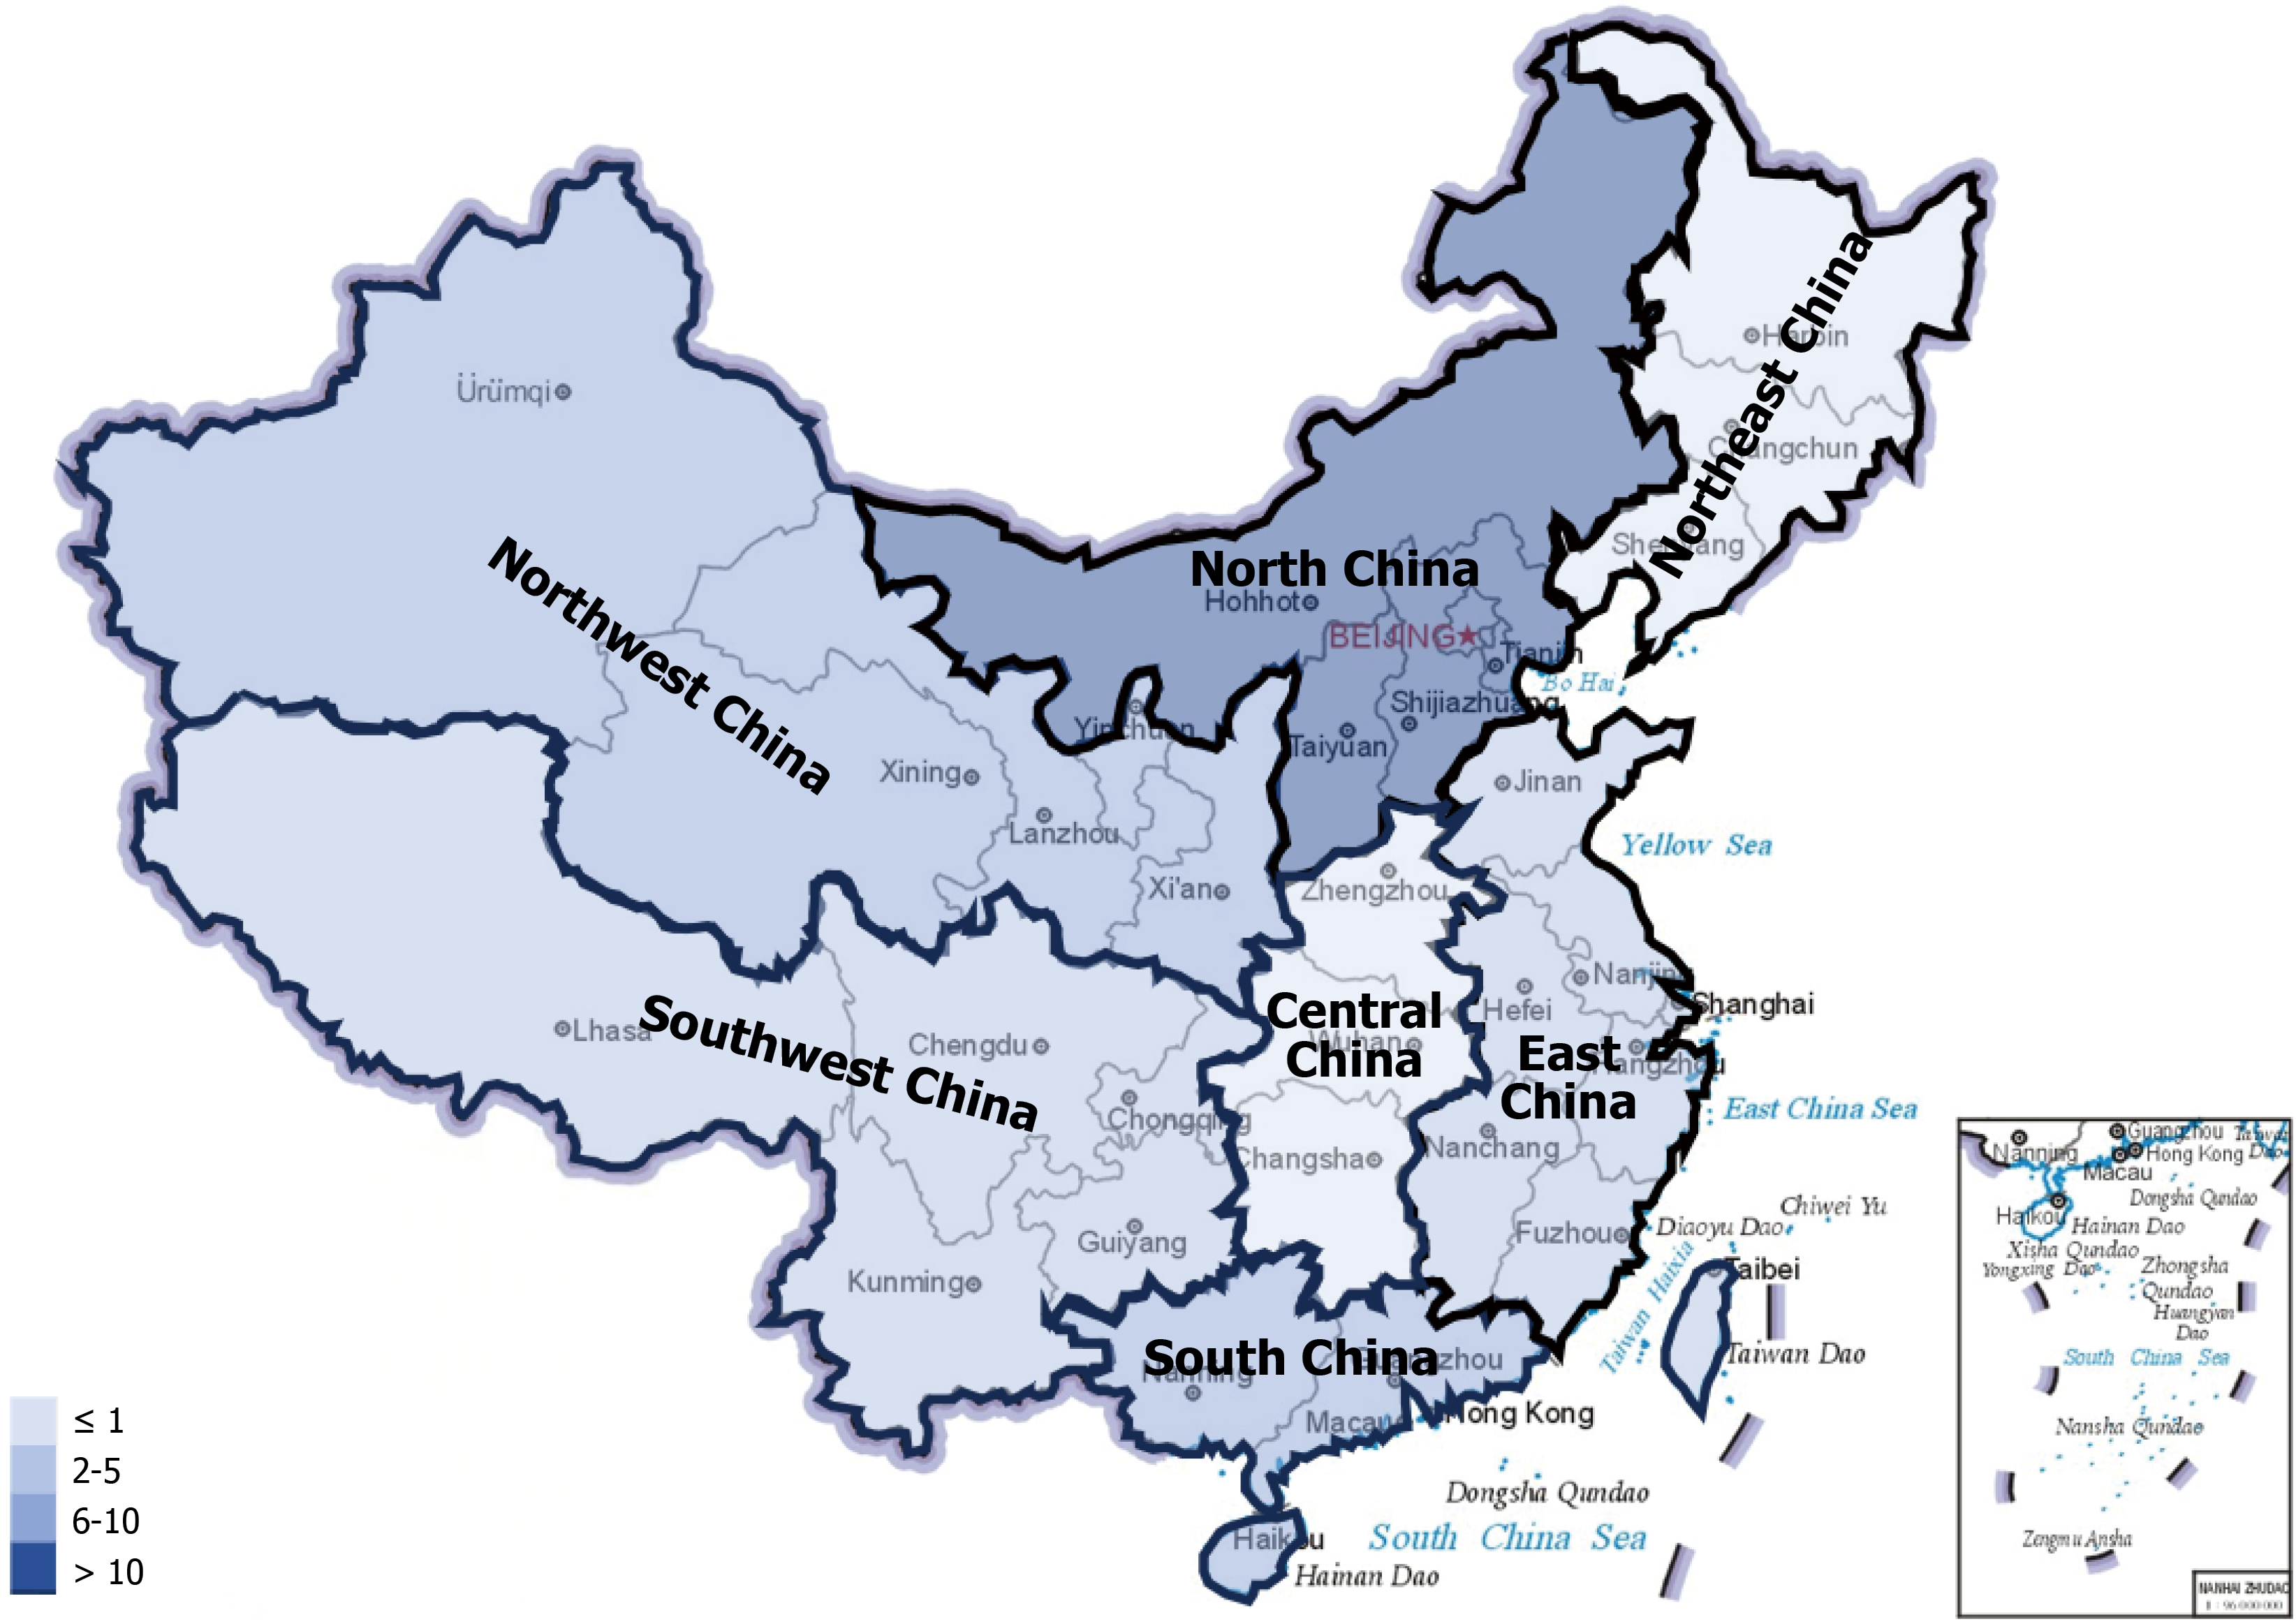
Figure 3 Geographic distribution of respondents in China.
The sample size and proportion for each geographic region are as follows: (1) Northeast (1/112, 0.89%); (2) North China (94/112, 83.93%); (3) Northwest (5/112, 4.46%); (4) Southwest (1/112, 0.89%); (5) Central China (1/112, 0.89%); (6) East China (3/112, 2.68%); and (7) South China (7/112, 6.25%).
- Citation: Wang RG, Dong HB. Application prospects of phased-array computed tomography in the diagnosis and treatment of digestive system diseases: A cross-sectional survey. World J Gastroenterol 2026; 32(34): 119523
- URL: https://www.wjgnet.com/1007-9327/full/v32/i34/119523.htm
- DOI: https://dx.doi.org/10.3748/wjg.119523