
















Copyright: ©Author(s) 2026.
World J Gastroenterol. Sep 14, 2026; 32(34): 119467
Published online Sep 14, 2026. doi: 10.3748/wjg.119467
Published online Sep 14, 2026. doi: 10.3748/wjg.119467
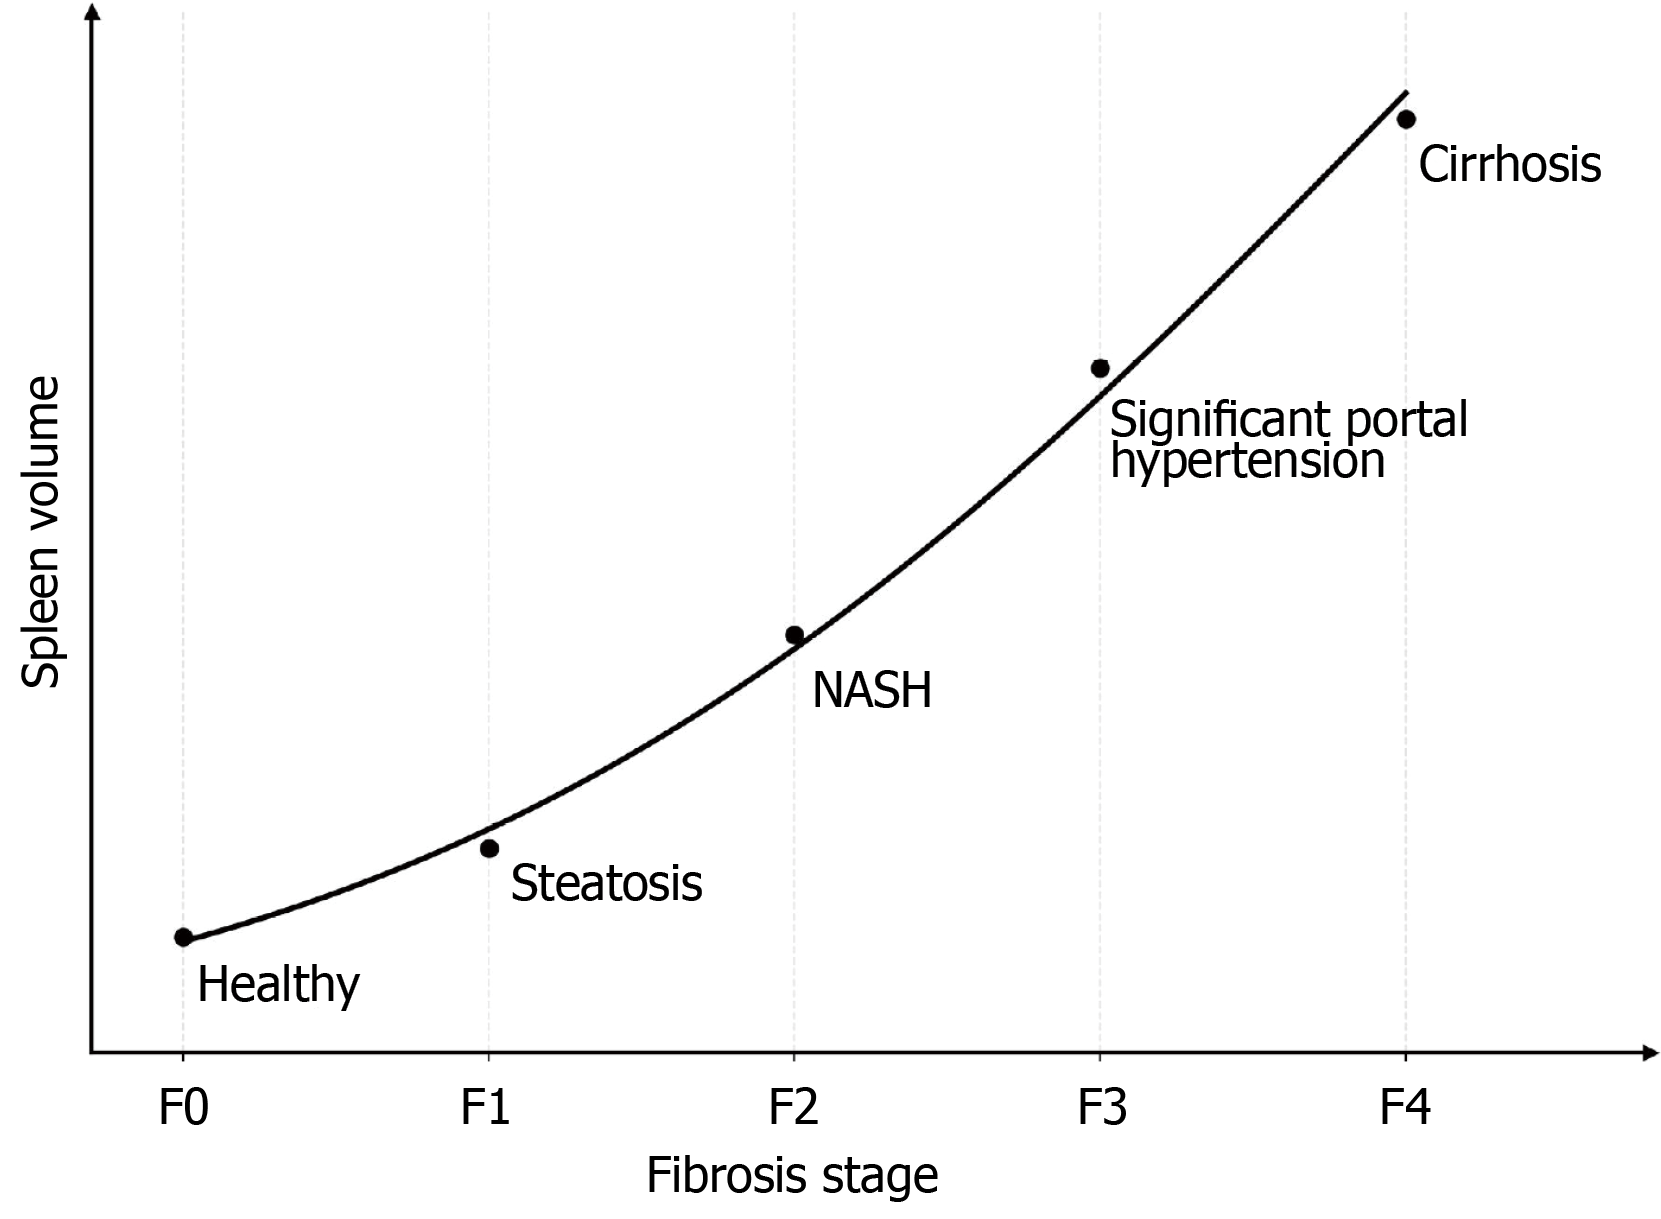
Figure 2 Line graph showing the trend of the spleen volume vs fibrosis in non-alcoholic fatty liver disease.
Splenic volume generally increases in parallel with the progression of liver fibrosis, with the most significant increases often observed in the transition from F3 to F4, although this can be variable due to collateral circulation. NASH: Nonalcoholic steatohepatitis.
- Citation: Tarantino G, Citro V. Liver-spleen axis: Deciphering a crucial crosstalk in non-alcoholic fatty liver disease progression and therapeutic implications. World J Gastroenterol 2026; 32(34): 119467
- URL: https://www.wjgnet.com/1007-9327/full/v32/i34/119467.htm
- DOI: https://dx.doi.org/10.3748/wjg.119467