
















Copyright: ©Author(s) 2026.
World J Gastroenterol. Sep 7, 2026; 32(33): 118584
Published online Sep 7, 2026. doi: 10.3748/wjg.118584
Published online Sep 7, 2026. doi: 10.3748/wjg.118584
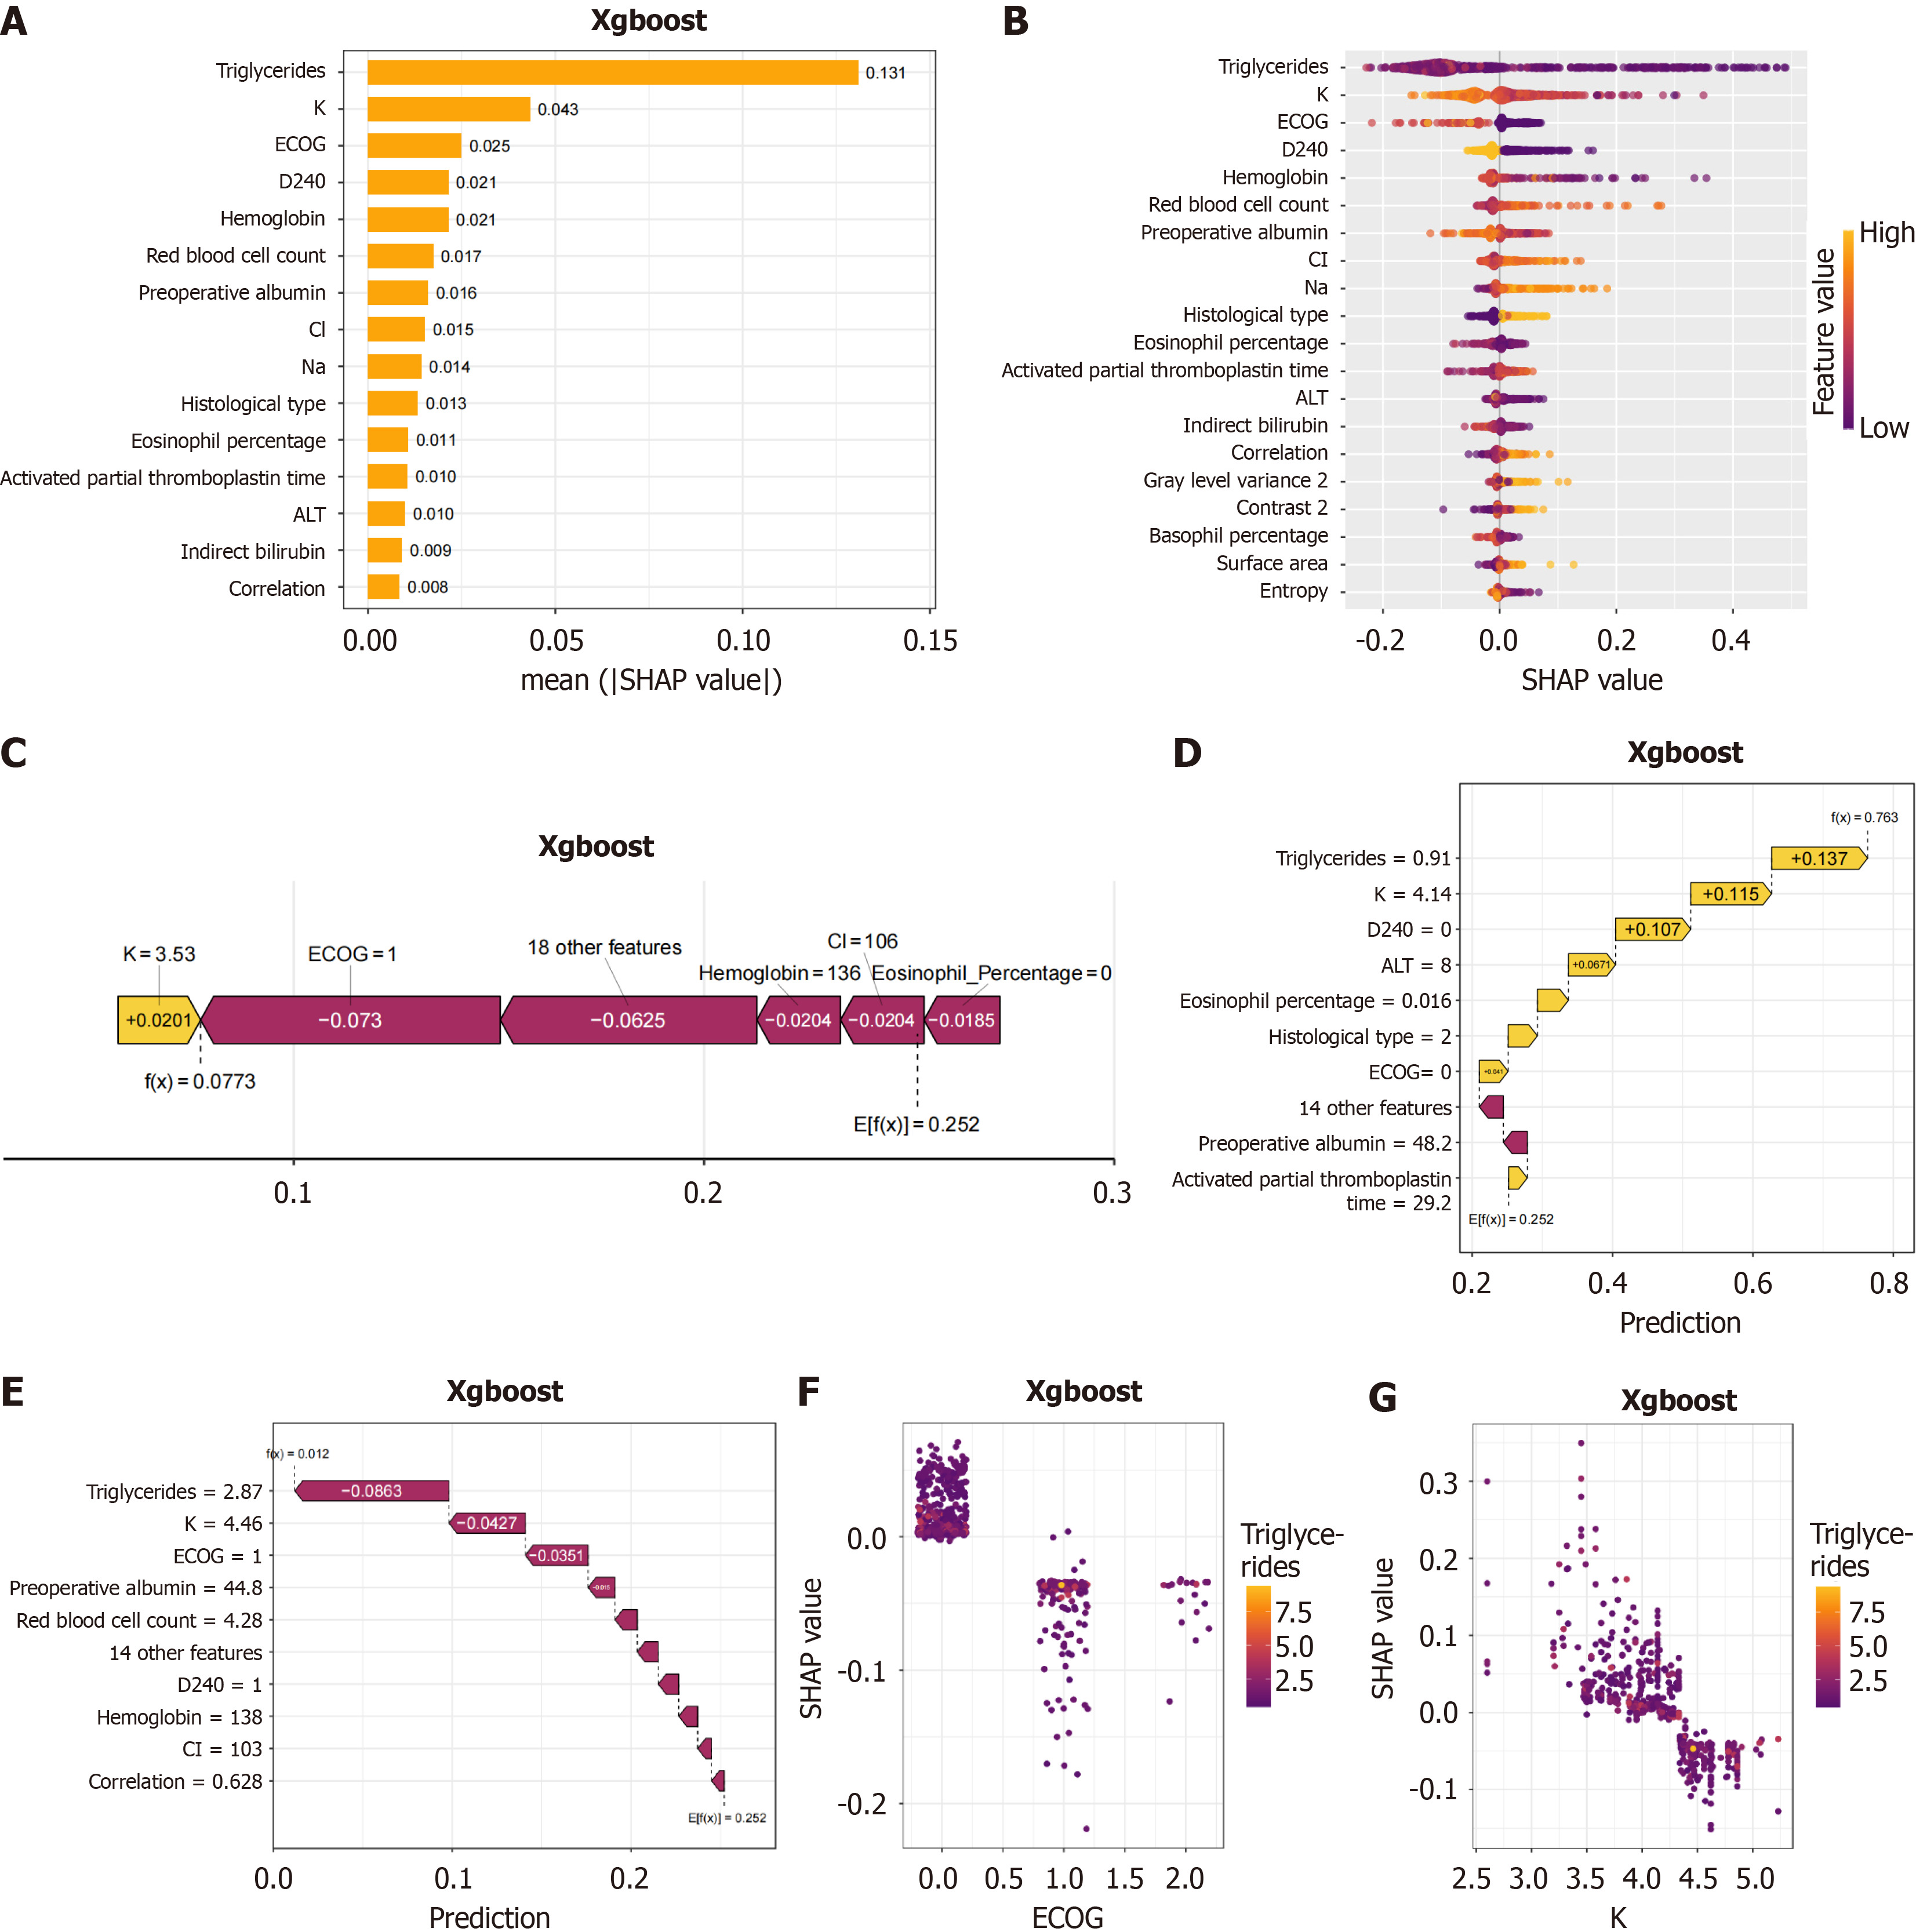
Figure 4 SHapley Additive exPlanations interpretation of the XGBoost model.
A: SHapley Additive exPlanations (SHAP) summary bar plot; B: SHAP summary bee-swarm plot; C: SHAP force plot for individual explanation; D and E: SHAP waterfall plots for individual explanation; F: SHAP partial dependence plot for serum triglycerides and Eastern Cooperative Oncology Group performance score; G: SHAP partial dependence plot for serum triglycerides and serum potassium. ALT: Alanine aminotransferase; ECOG: Eastern Cooperative Oncology Group; SHAP: SHapley Additive exPlanations.
- Citation: Kang BY, Bai H, Ni K, Qiao YH, Li YL, Wang YQ, Wang Q, Zhu J, Li JP. Artificial intelligence-integrated multimodal data-assisted magnetic resonance imaging for neoadjuvant chemoradiotherapy decision-making in cT1-2N0 rectal cancer. World J Gastroenterol 2026; 32(33): 118584
- URL: https://www.wjgnet.com/1007-9327/full/v32/i33/118584.htm
- DOI: https://dx.doi.org/10.3748/wjg.118584