
















Copyright: ©Author(s) 2026.
World J Gastroenterol. Aug 28, 2026; 32(32): 120450
Published online Aug 28, 2026. doi: 10.3748/wjg.120450
Published online Aug 28, 2026. doi: 10.3748/wjg.120450
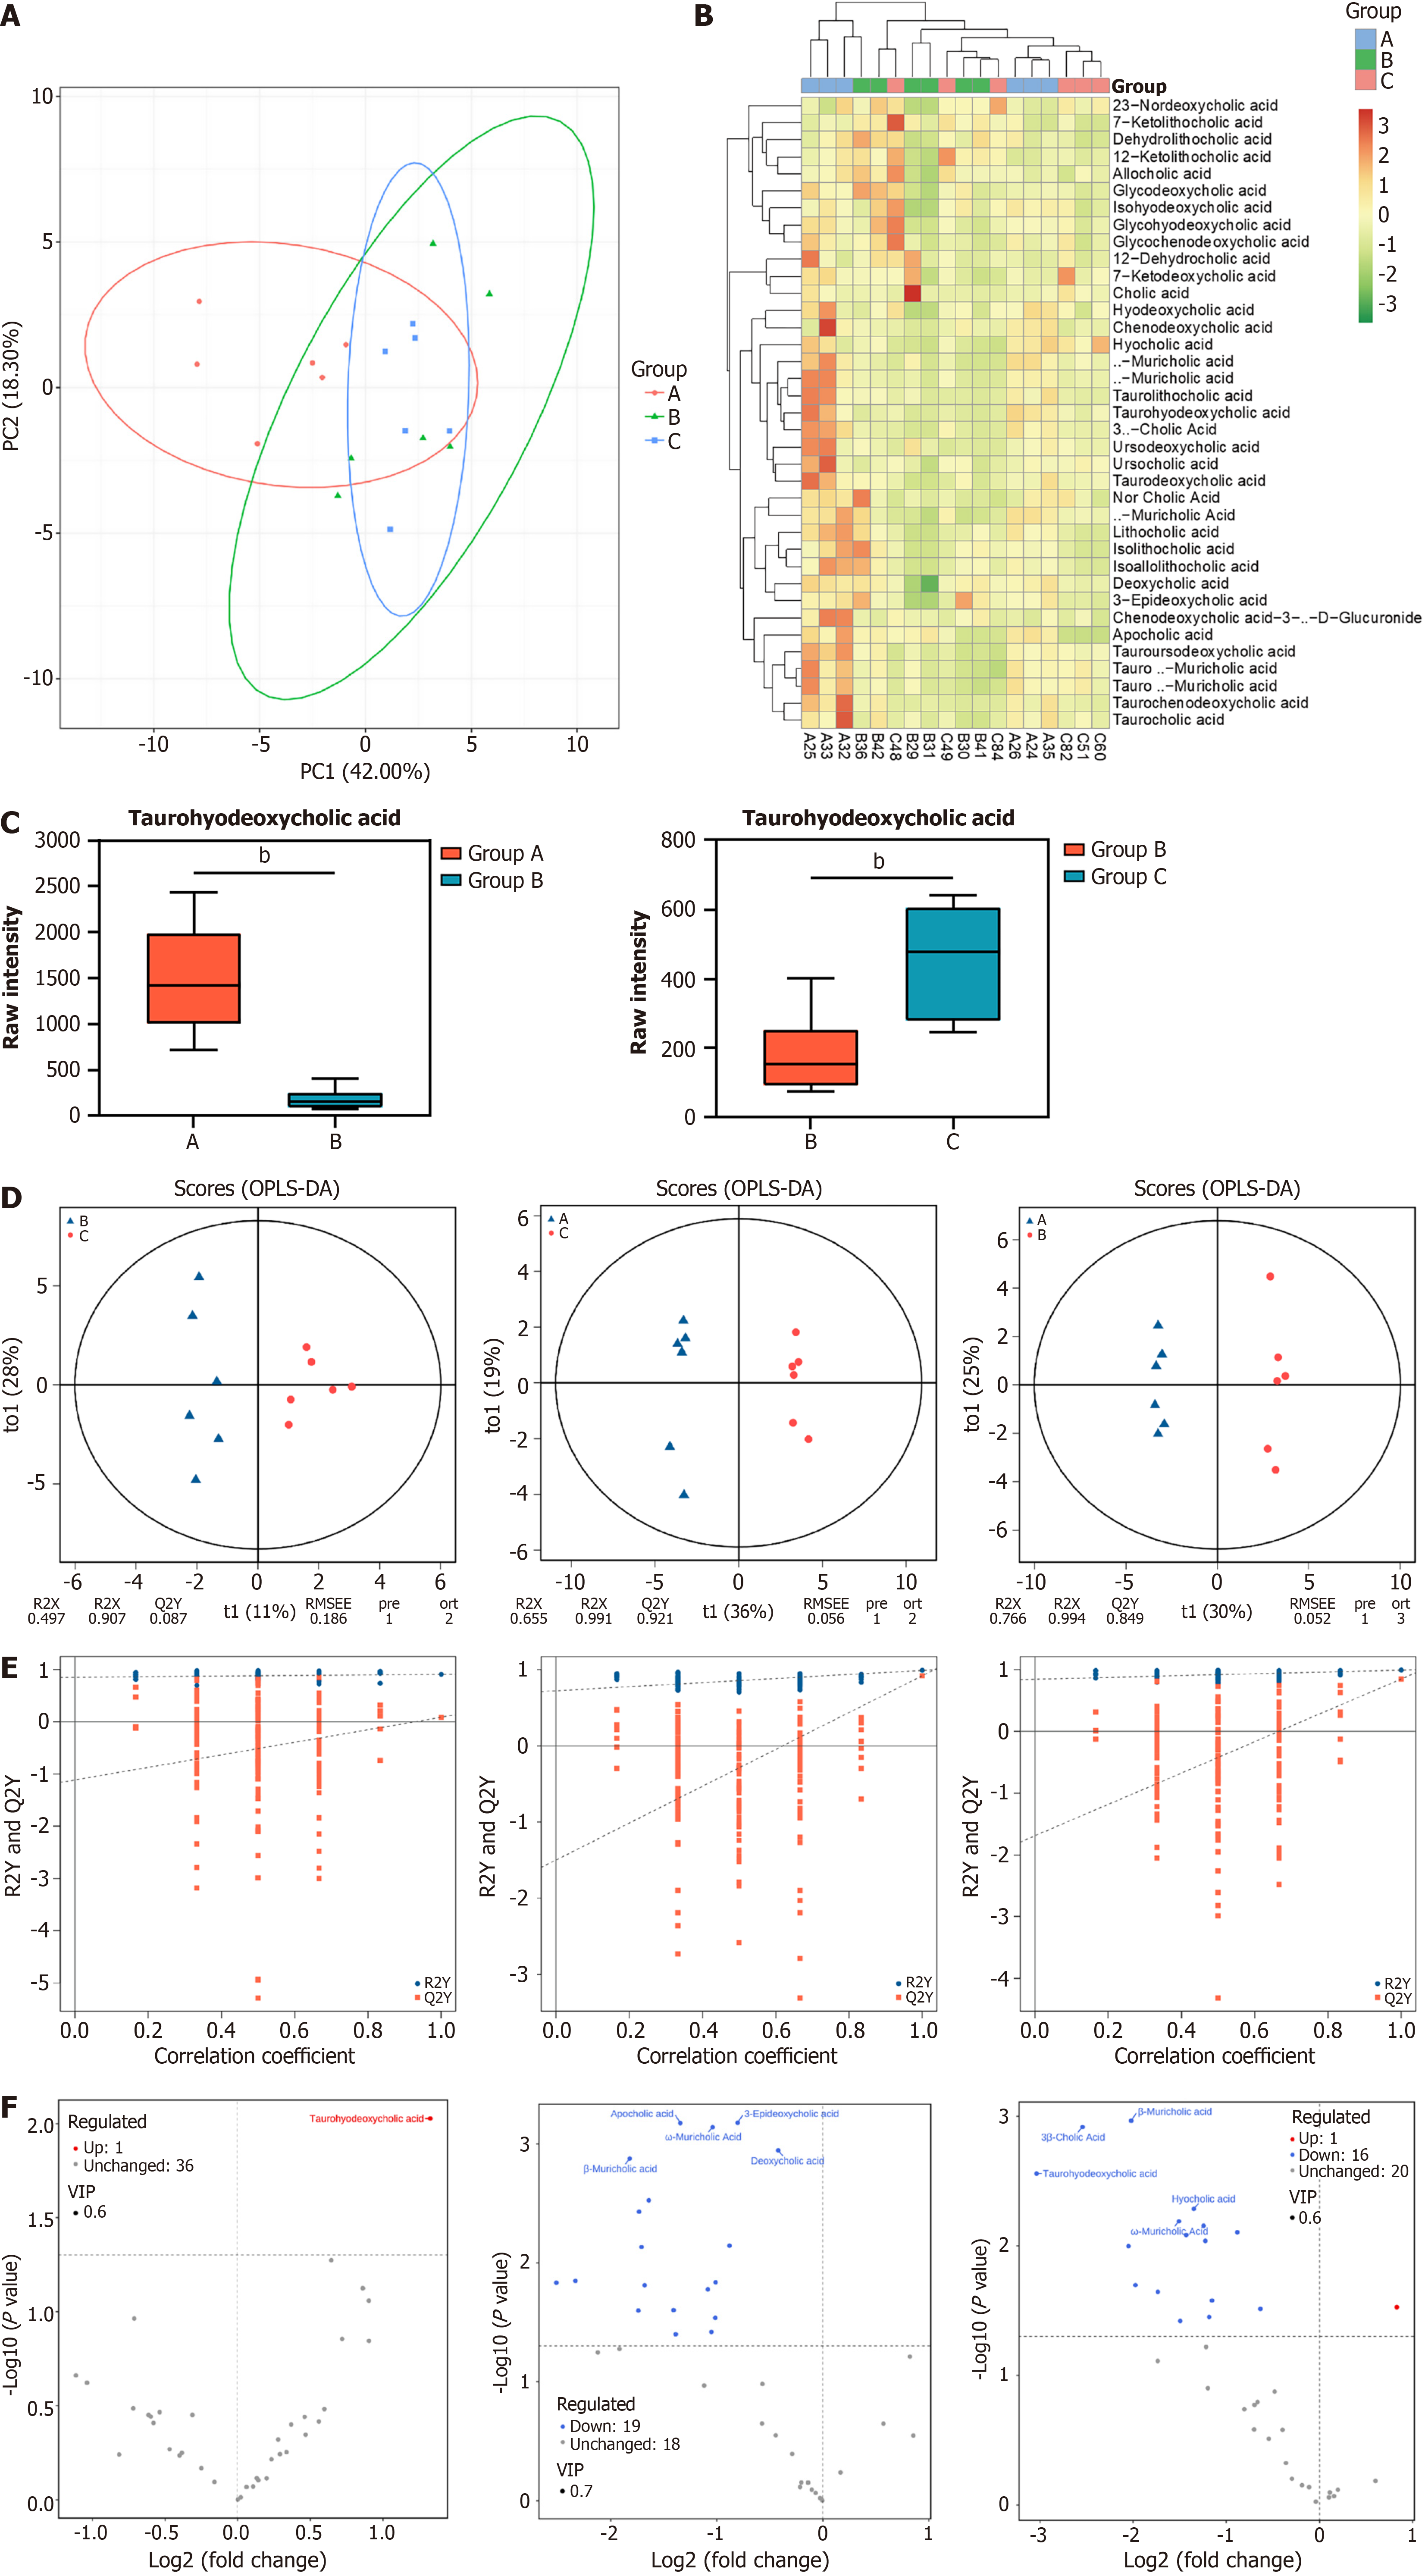
Figure 7 Metabolomic profiling analysis of bile acids in mouse colon.
A: Principal component analysis of all samples. Each point represents a sample, with samples from different groups labeled in different colors; B: Clustering heatmap showing the overall sample distribution; C: Comparison of taurohyodeoxycholic acid levels between different groups; D: Orthogonal partial least squares-discriminant analysis score plots of dextran sulfate sodium (DSS) vs extracts from Gleditsia sinensis thorns (EGST), control vs EGST, and control vs DSS groups; E: Permutation test plots of orthogonal partial least squares-discriminant analysis models for different groups; F: Volcano plots of differential metabolites comparing DSS vs EGST, control vs EGST, and control vs DSS groups. In the figures, 18 mice were randomly allocated to three groups: Control (A), DSS (B), and EGST-H (C).
- Citation: Zhuo ZY, Guo XY, Liu XM, Shang MM, Xue S, Peng L, Guo ZG. Extracts of Gleditsia sinensis Lam. thorn ameliorates ulcerative colitis through PPARγ/GPX4 pathway-mediated inhibition of enterocyte ferroptosis. World J Gastroenterol 2026; 32(32): 120450
- URL: https://www.wjgnet.com/1007-9327/full/v32/i32/120450.htm
- DOI: https://dx.doi.org/10.3748/wjg.120450