
















Copyright: ©Author(s) 2026.
World J Gastroenterol. Aug 28, 2026; 32(32): 118570
Published online Aug 28, 2026. doi: 10.3748/wjg.118570
Published online Aug 28, 2026. doi: 10.3748/wjg.118570
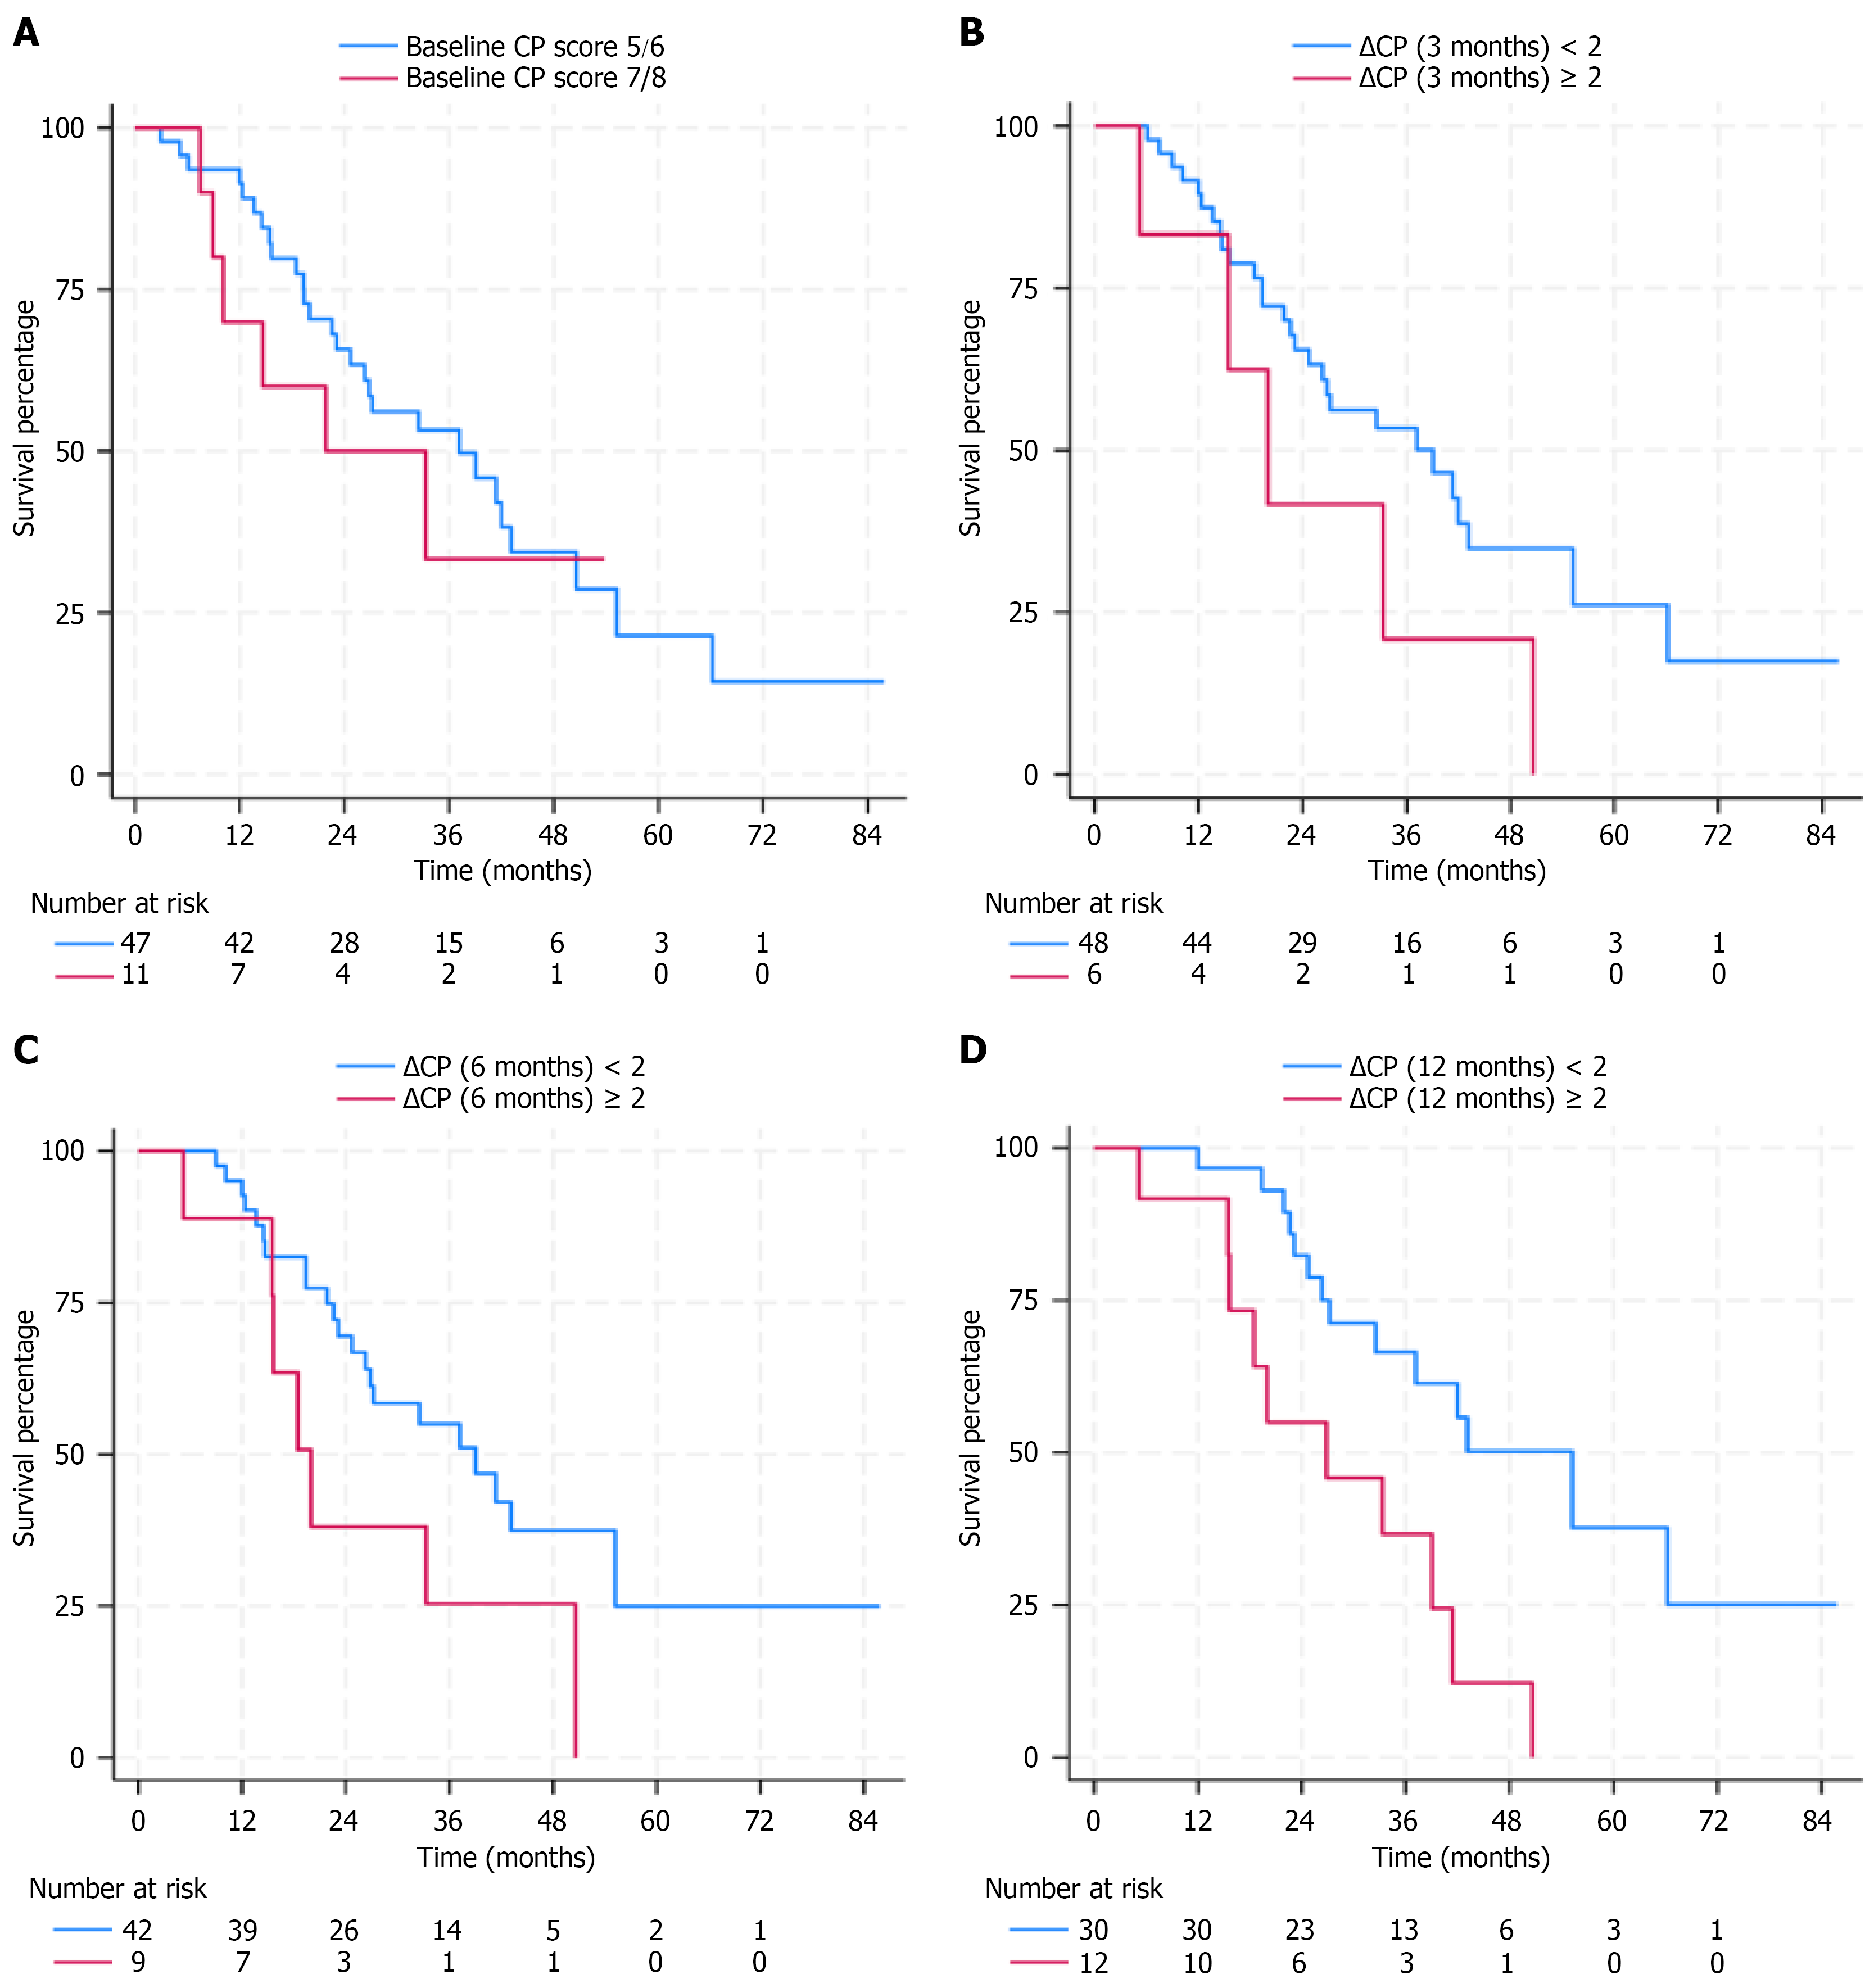
Figure 3 Kaplan-Meier overall survival curves stratified by Child-Pugh score.
A: Baseline Child-Pugh score: Child-Pugh 5-6 (Child-Pugh A) vs Child-Pugh 7-8 (Child-Pugh B); B: Child-Pugh change at 3 months (< 2 vs ≥ 2 points increase); C: Child-Pugh change at 6 months (< 2 vs ≥ 2 points increase); D: Child-Pugh change at 12 months (< 2 vs ≥ 2 points increase).
- Citation: Fong SC, Ng SP, Italiano D, Chung W, Vaz K, Fink M, Goodwin M, Ranatunga D, Khor R. Stereotactic body radiotherapy for hepatocellular carcinoma: Five-year prospective registry outcomes from an Australian tertiary transplant centre. World J Gastroenterol 2026; 32(32): 118570
- URL: https://www.wjgnet.com/1007-9327/full/v32/i32/118570.htm
- DOI: https://dx.doi.org/10.3748/wjg.118570