
















Copyright: ©Author(s) 2026.
World J Gastroenterol. Aug 21, 2026; 32(31): 118472
Published online Aug 21, 2026. doi: 10.3748/wjg.118472
Published online Aug 21, 2026. doi: 10.3748/wjg.118472
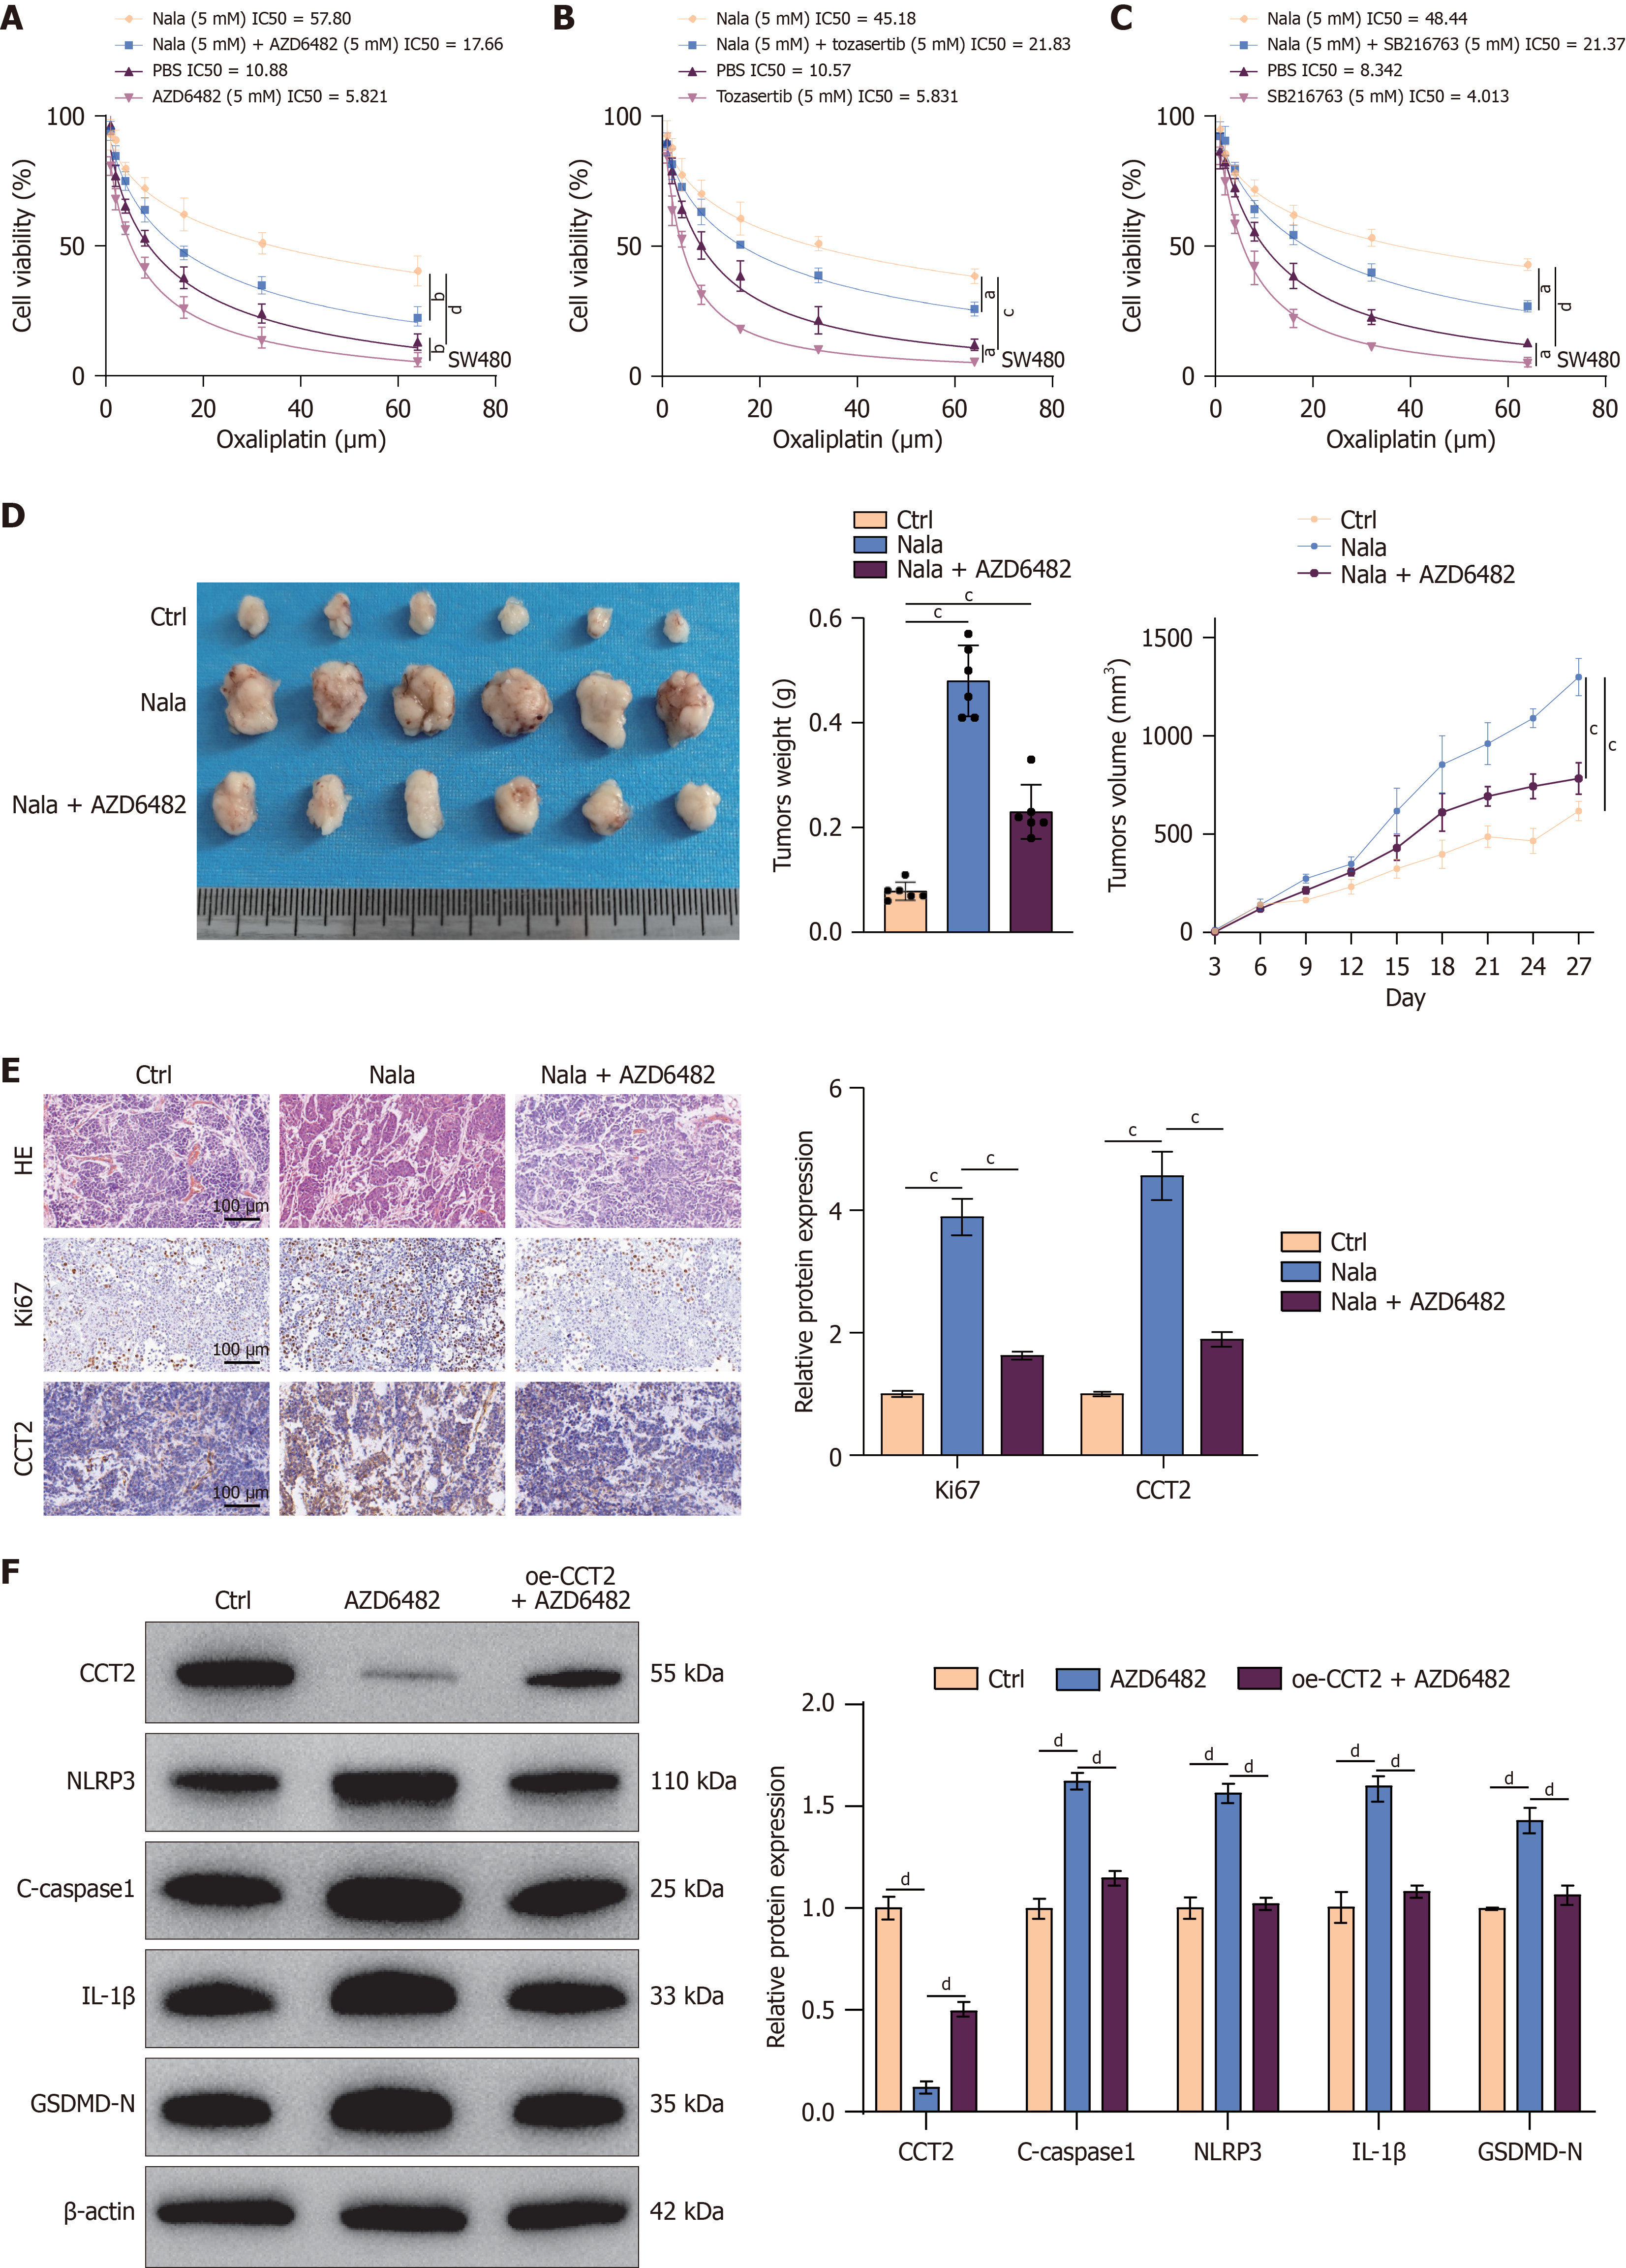
Figure 5 AZD6482 enhances the cytotoxic sensitivity of oxaliplatin to colorectal cancer cells in a high-lactate microenvironment.
A: SW480 cells (5 × 10³ cells/well) cultured in medium containing different concentrations of oxaliplatin (0, 1, 2, 5, 10, 25, 50, and 100 μM) with the following treatments added simultaneously: Phosphate-buffered saline (PBS), 5 mmol/L sodium lactate (Nala), PBS + 20 μM AZD6482, or 5 mmol/L Nala + 20 μM AZD6482. After 48 hours of further culture, the cell counting kit-8 (CCK-8) kit was used to detect cell viability, and cell survival curves were plotted; B: SW480 cells were seeded as in (A), cultured in medium with gradient concentrations of oxaliplatin (0-100 μM), and treated with PBS, 5 mmol/L Nala, PBS + 5 μM SB216763, or 5 mmol/L Nala + 5 μM SB216763, respectively. After 48 hours of culture, the CCK-8 method was used to detect cell viability, and survival curves were plotted; C: Cells were seeded as in (B), cultured under conditions with different concentrations of oxaliplatin, and supplemented with PBS, 5 mmol/L Nala, PBS + 5 μM Tozasertib, or 5 mmol/L Nala + 5 μM Tozasertib. After 48 hours, cell viability was detected using the CCK-8 assay, and dose-response curves were generated; D: SW480 cells (1 × 10⁶ cells/mouse) were subcutaneously inoculated into BALB/c nude mice to establish a cell line-derived xenograft model. Tumor volume was measured every 3 days starting from day 6 post-inoculation. From day 7 post-inoculation, mice received the following treatments via daily gavage: PBS (control), 200 mg/kg Nala, or 200 mg/kg Nala + 50 mg/kg AZD6482. Mice were euthanized 28 days later. Tumor photographs (left panel), tumor weight (middle panel, n = 6), and tumor growth curves (right panel); E: A portion of the xenograft tumor tissues obtained in (D) was subjected to hematoxylin-eosin staining, and another portion was used for immunohistochemistry detection of the expression levels of Ki67 and CCT2, followed by quantitative analysis; F: SW480 cells stably overexpressing oe-NC (control) or oe-CCT2 were treated with 20 μM AZD6482 for 24 hours. Western blotting was performed to detect the protein expression levels of METTL5, CCT2, GSDMD-N, NLRP3, and cleaved Caspase-1 (C-caspase1), and grayscale quantitative analysis of the bands was conducted. PBS: Phosphate-buffered saline; Nala: Sodium lactate; HE: Hematoxylin-eosin. aP < 0.05, bP < 0.01, cP < 0.001, and dP < 0.0001.
- Citation: Wang XP, Liu C, Zhang HW, Zhai JM, Zhu JX, Sun GD, An YH, Yang HJ, Jing DS, Liu DC. H3K18 La-METTL5-CCT2 signaling axis promotes colorectal cancer progression by inhibiting pyroptosis. World J Gastroenterol 2026; 32(31): 118472
- URL: https://www.wjgnet.com/1007-9327/full/v32/i31/118472.htm
- DOI: https://dx.doi.org/10.3748/wjg.118472