
















Copyright: ©Author(s) 2026.
World J Gastroenterol. Aug 14, 2026; 32(30): 119465
Published online Aug 14, 2026. doi: 10.3748/wjg.v32.i30.119465
Published online Aug 14, 2026. doi: 10.3748/wjg.v32.i30.119465
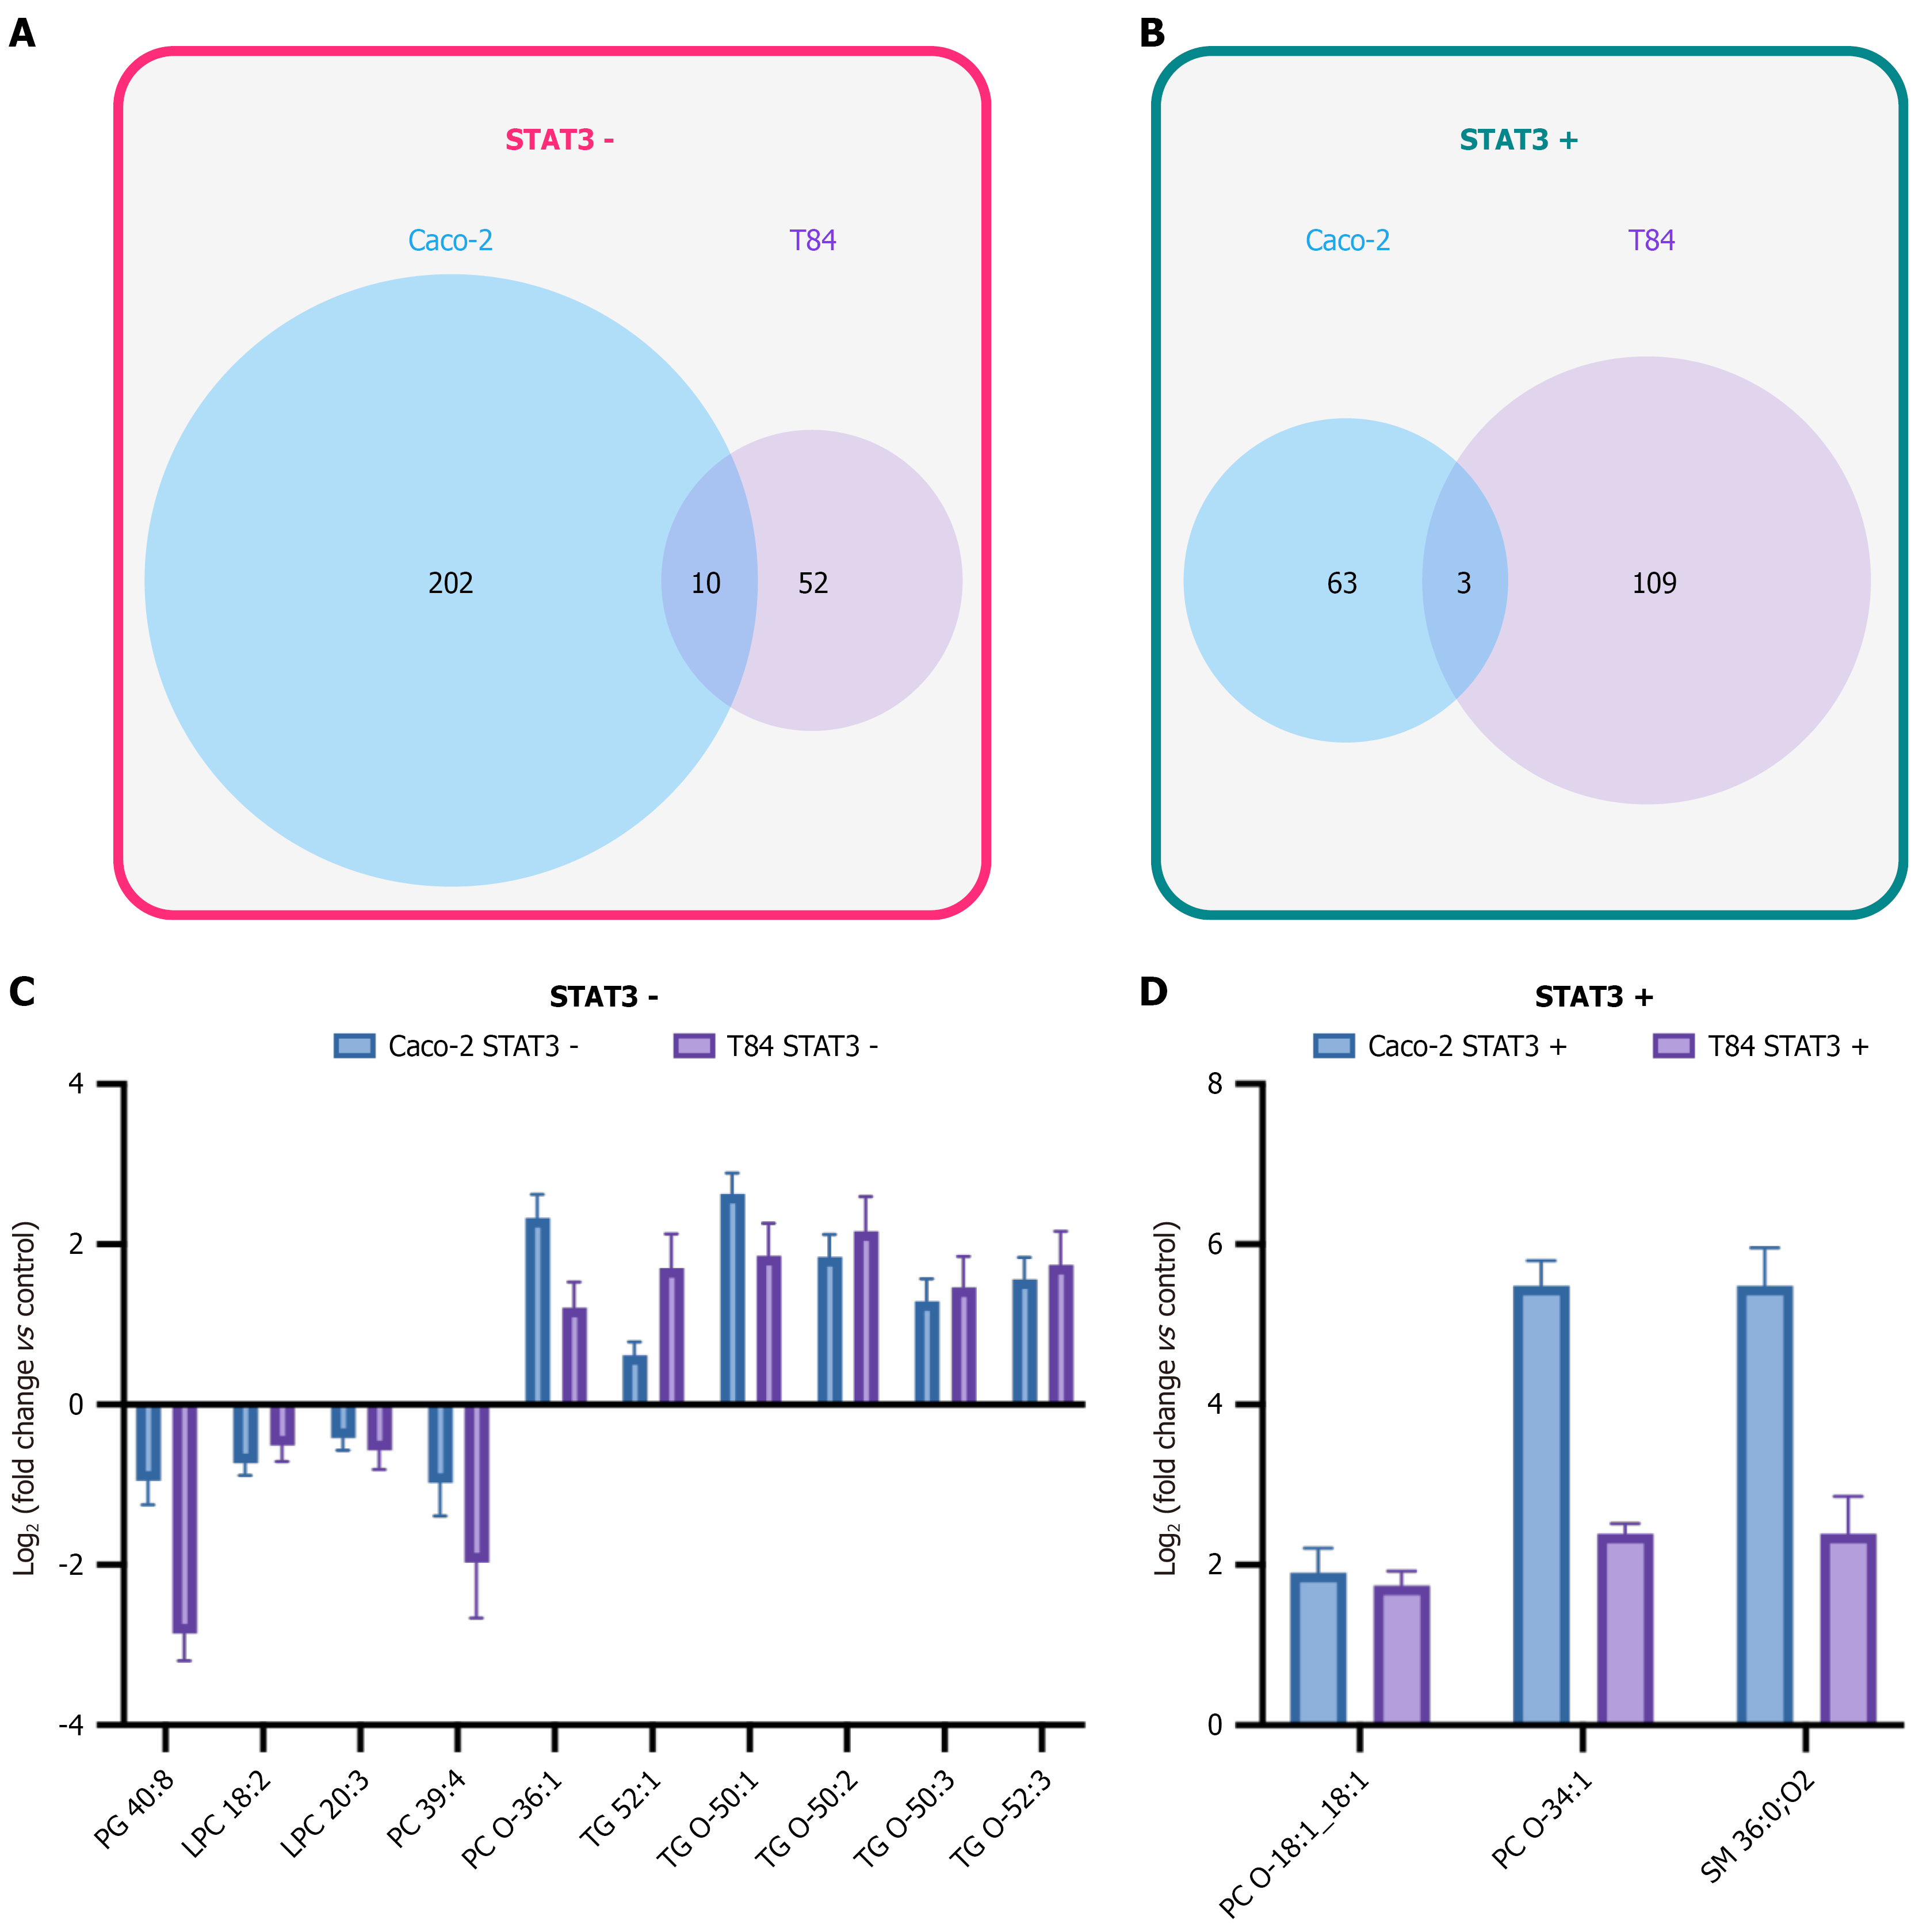
Figure 6 Identification of signal transducer and activator of transcription 3-dependent differences of lipid species by liquid chromatography high-resolution mass spectrometry analysis.
Caco-2 and T84 cell monolayers were generated over a period of 28 days. Thereafter, cells were harvested and lipidomic analysis was performed. A and B: Venn diagrams illustrate the number of significantly altered lipid species in decreased signal transducer and activator of transcription 3 (STAT3) (STAT3 -) and enhanced STAT3 (STAT3 +) expressing Caco-2 and T84 cell monolayers compared to the controls. The overlapping area represents lipids significantly regulated in both epithelial models, indicating STAT3-dependent lipid remodeling; C and D: Bars show all lipid species that were significantly changed in Caco-2 as well as T84 monolayers (see also A and B), respectively. Bars represent mean log2 fold change ± SEM. Cross-validation across two independent intestinal epithelial models ensures robustness and minimizes false-positive discovery. P < 0.05, two-sided Welch’s t-test (n = 5). STAT3: Signal transducer and activator of transcription 3; PG: Phosphatidylglycerol; LPC: Lysophosphatidylcholines; PC: Phosphatidylcholine; TG: Triacylglycerol; SM: Sphingomyelin; PC O: Ether-linked phosphatidylcholine; TG O: Ether-linked triacylglycerol.
- Citation: Leinz N, Beyer S, Yoganathan-Kugarajan B, Kraus N, Ortiz C, Hahnefeld L, Gurke R, Başoğlu M, Plotz G, Eimer S, Zeuzem S, Trebicka J, Welsch C, Brieger A. Dysregulated signal transducer and activator of transcription 3 drives intestinal permeability and may contribute to acute-on-chronic liver failure. World J Gastroenterol 2026; 32(30): 119465
- URL: https://www.wjgnet.com/1007-9327/full/v32/i30/119465.htm
- DOI: https://dx.doi.org/10.3748/wjg.v32.i30.119465