
















Copyright: ©Author(s) 2026.
World J Gastroenterol. Aug 14, 2026; 32(30): 119360
Published online Aug 14, 2026. doi: 10.3748/wjg.119360
Published online Aug 14, 2026. doi: 10.3748/wjg.119360
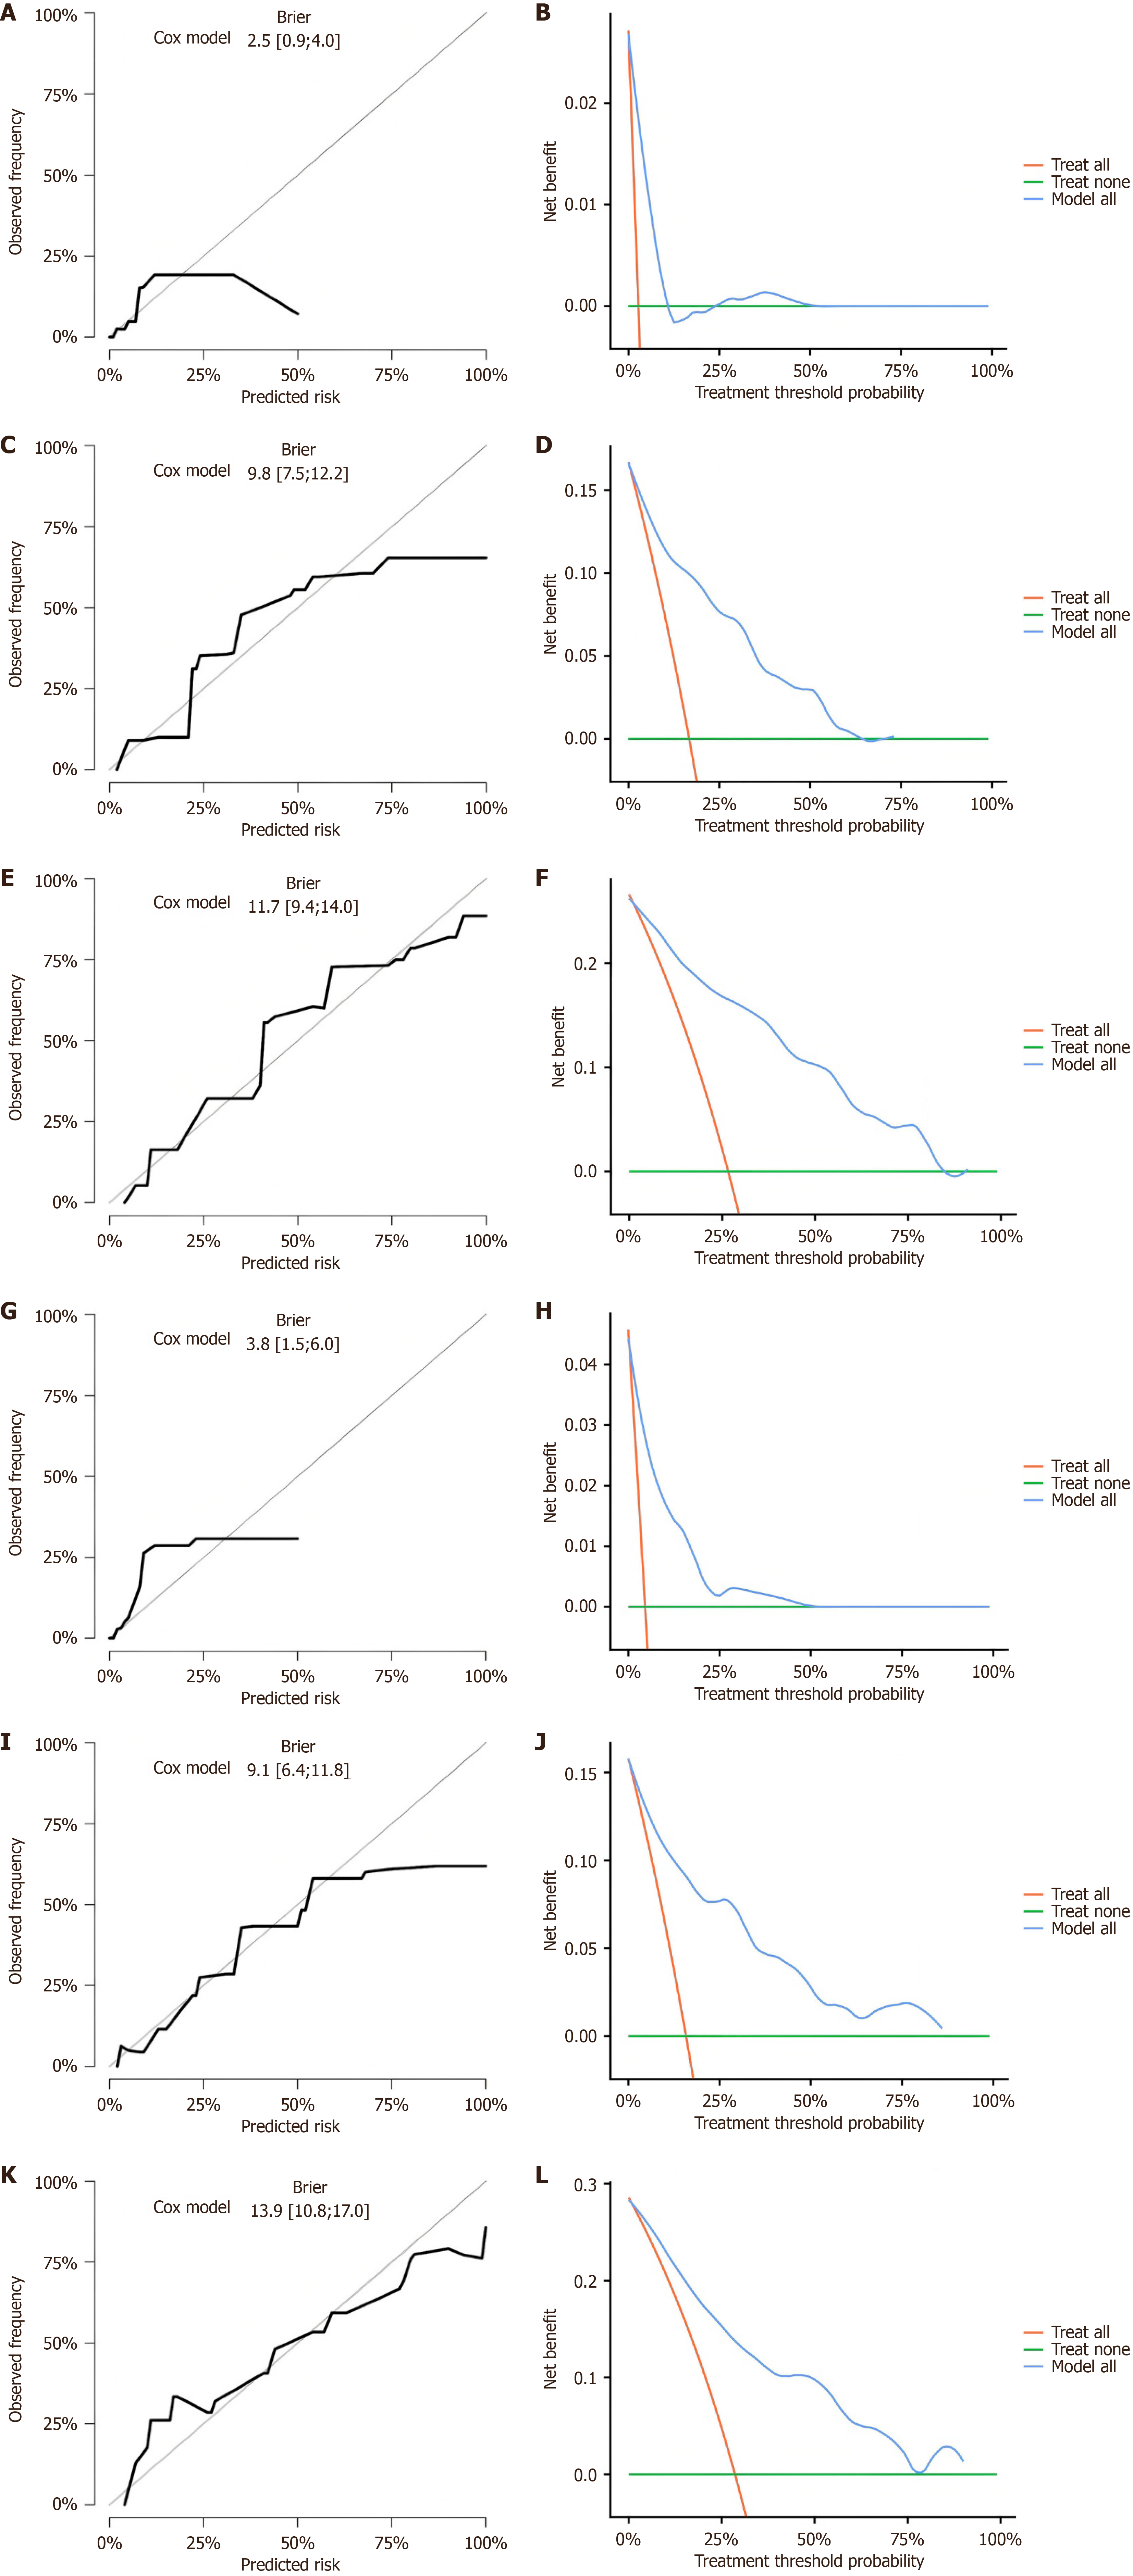
Figure 8 Calibration curves and decision curve analysis of the nomogram for predicting 1-, 3-, and 5-year overall survival in the training cohort and validation cohort.
A-F: In the training cohort: Calibration curve at 1 year (A); Decision curve analysis (DCA) curve at 1 year (B); Calibration curve at 3 years (C); DCA curve at 3 years (D); Calibration curve at 5 years (E); DCA curve at 5 years (F); G-L: In the validation cohort: Calibration curve at 1 year (G); DCA curve at 1 year (H); Calibration curve at 3 years (I); DCA curve at 3 years (J); Calibration curve at 5 years (K); DCA curve at 5 years (L). For calibration, the X-axis indicates predicted risk and the Y-axis indicates observed frequency; the diagonal gray line indicates the ideal reference line and Brier scores are shown. For DCA, the X-axis indicates threshold probability and the Y-axis indicates net benefit; the nomogram (model all) is compared with treat all and treat none strategies.
- Citation: Wang K, Zhang BX, Li KJ, Guan JM, Li BY, Hong ZH, Zeng XY, Zhao ZL, Chen Y. Preoperative immunonutrition status predicts survival after colorectal cancer resection: Nomogram based on modified systemic inflammation score. World J Gastroenterol 2026; 32(30): 119360
- URL: https://www.wjgnet.com/1007-9327/full/v32/i30/119360.htm
- DOI: https://dx.doi.org/10.3748/wjg.119360