
















Copyright: ©Author(s) 2026.
World J Gastroenterol. Aug 14, 2026; 32(30): 119360
Published online Aug 14, 2026. doi: 10.3748/wjg.119360
Published online Aug 14, 2026. doi: 10.3748/wjg.119360
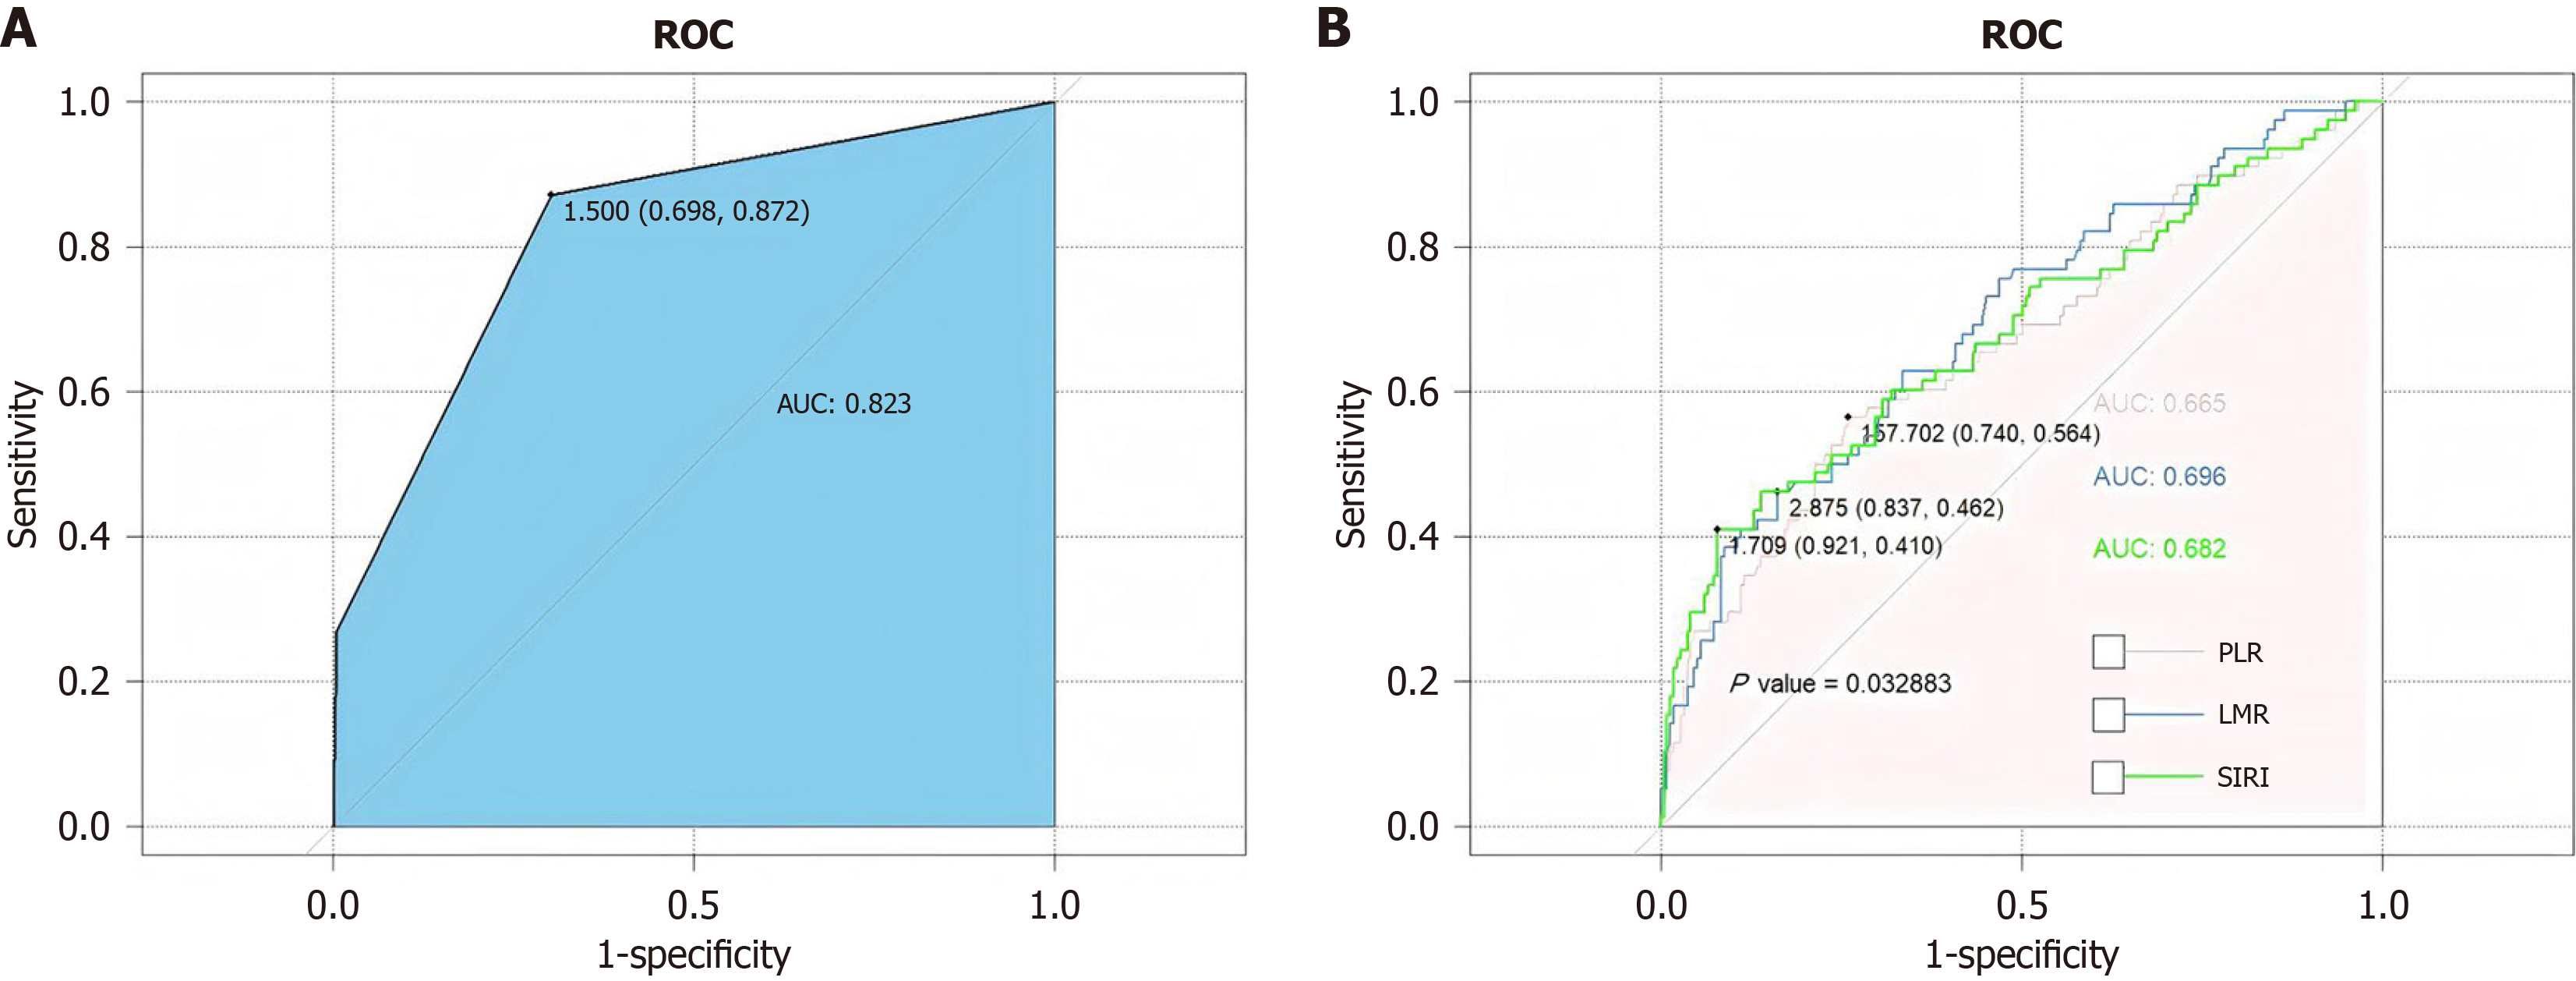
Figure 4 Receiver operating characteristic curve analysis of inflammation-related indicators in the training cohort.
A: Receiver operating characteristic (ROC) curve of the modified systemic inflammation score, with an area under the curve (AUC) of 0.823. The optimal cut-off value was 1.500 (sensitivity = 0.698, specificity = 0.872), as indicated in the figure; B: Comparison of ROC curves for platelet-to-lymphocyte ratio (PLR), lymphocyte-to-monocyte ratio (LMR), and systemic inflammation response index (SIRI). The AUCs were 0665 for PLR, 0.696 for LMR, and 0.682 for SIRI. The optimal cut-off values were 157.702 for PLR (sensitivity = 0.740, specificity = 0.564), 2.875 for LMR (sensitivity = 0.837, specificity = 0.462), and 1.709 for SIRI (sensitivity = 0.921, specificity = 0.410). The difference among the ROC curves was statistically significant (P = 0.032883). ROC: Receiver operating characteristic; AUC: Area under the curve; PLR: Platelet-to-lymphocyte ratio; LMR: Lymphocyte-to-monocyte ratio; SIRI: Systemic inflammation response index.
- Citation: Wang K, Zhang BX, Li KJ, Guan JM, Li BY, Hong ZH, Zeng XY, Zhao ZL, Chen Y. Preoperative immunonutrition status predicts survival after colorectal cancer resection: Nomogram based on modified systemic inflammation score. World J Gastroenterol 2026; 32(30): 119360
- URL: https://www.wjgnet.com/1007-9327/full/v32/i30/119360.htm
- DOI: https://dx.doi.org/10.3748/wjg.119360