
















Copyright: ©Author(s) 2026.
World J Gastroenterol. Aug 14, 2026; 32(30): 119360
Published online Aug 14, 2026. doi: 10.3748/wjg.119360
Published online Aug 14, 2026. doi: 10.3748/wjg.119360
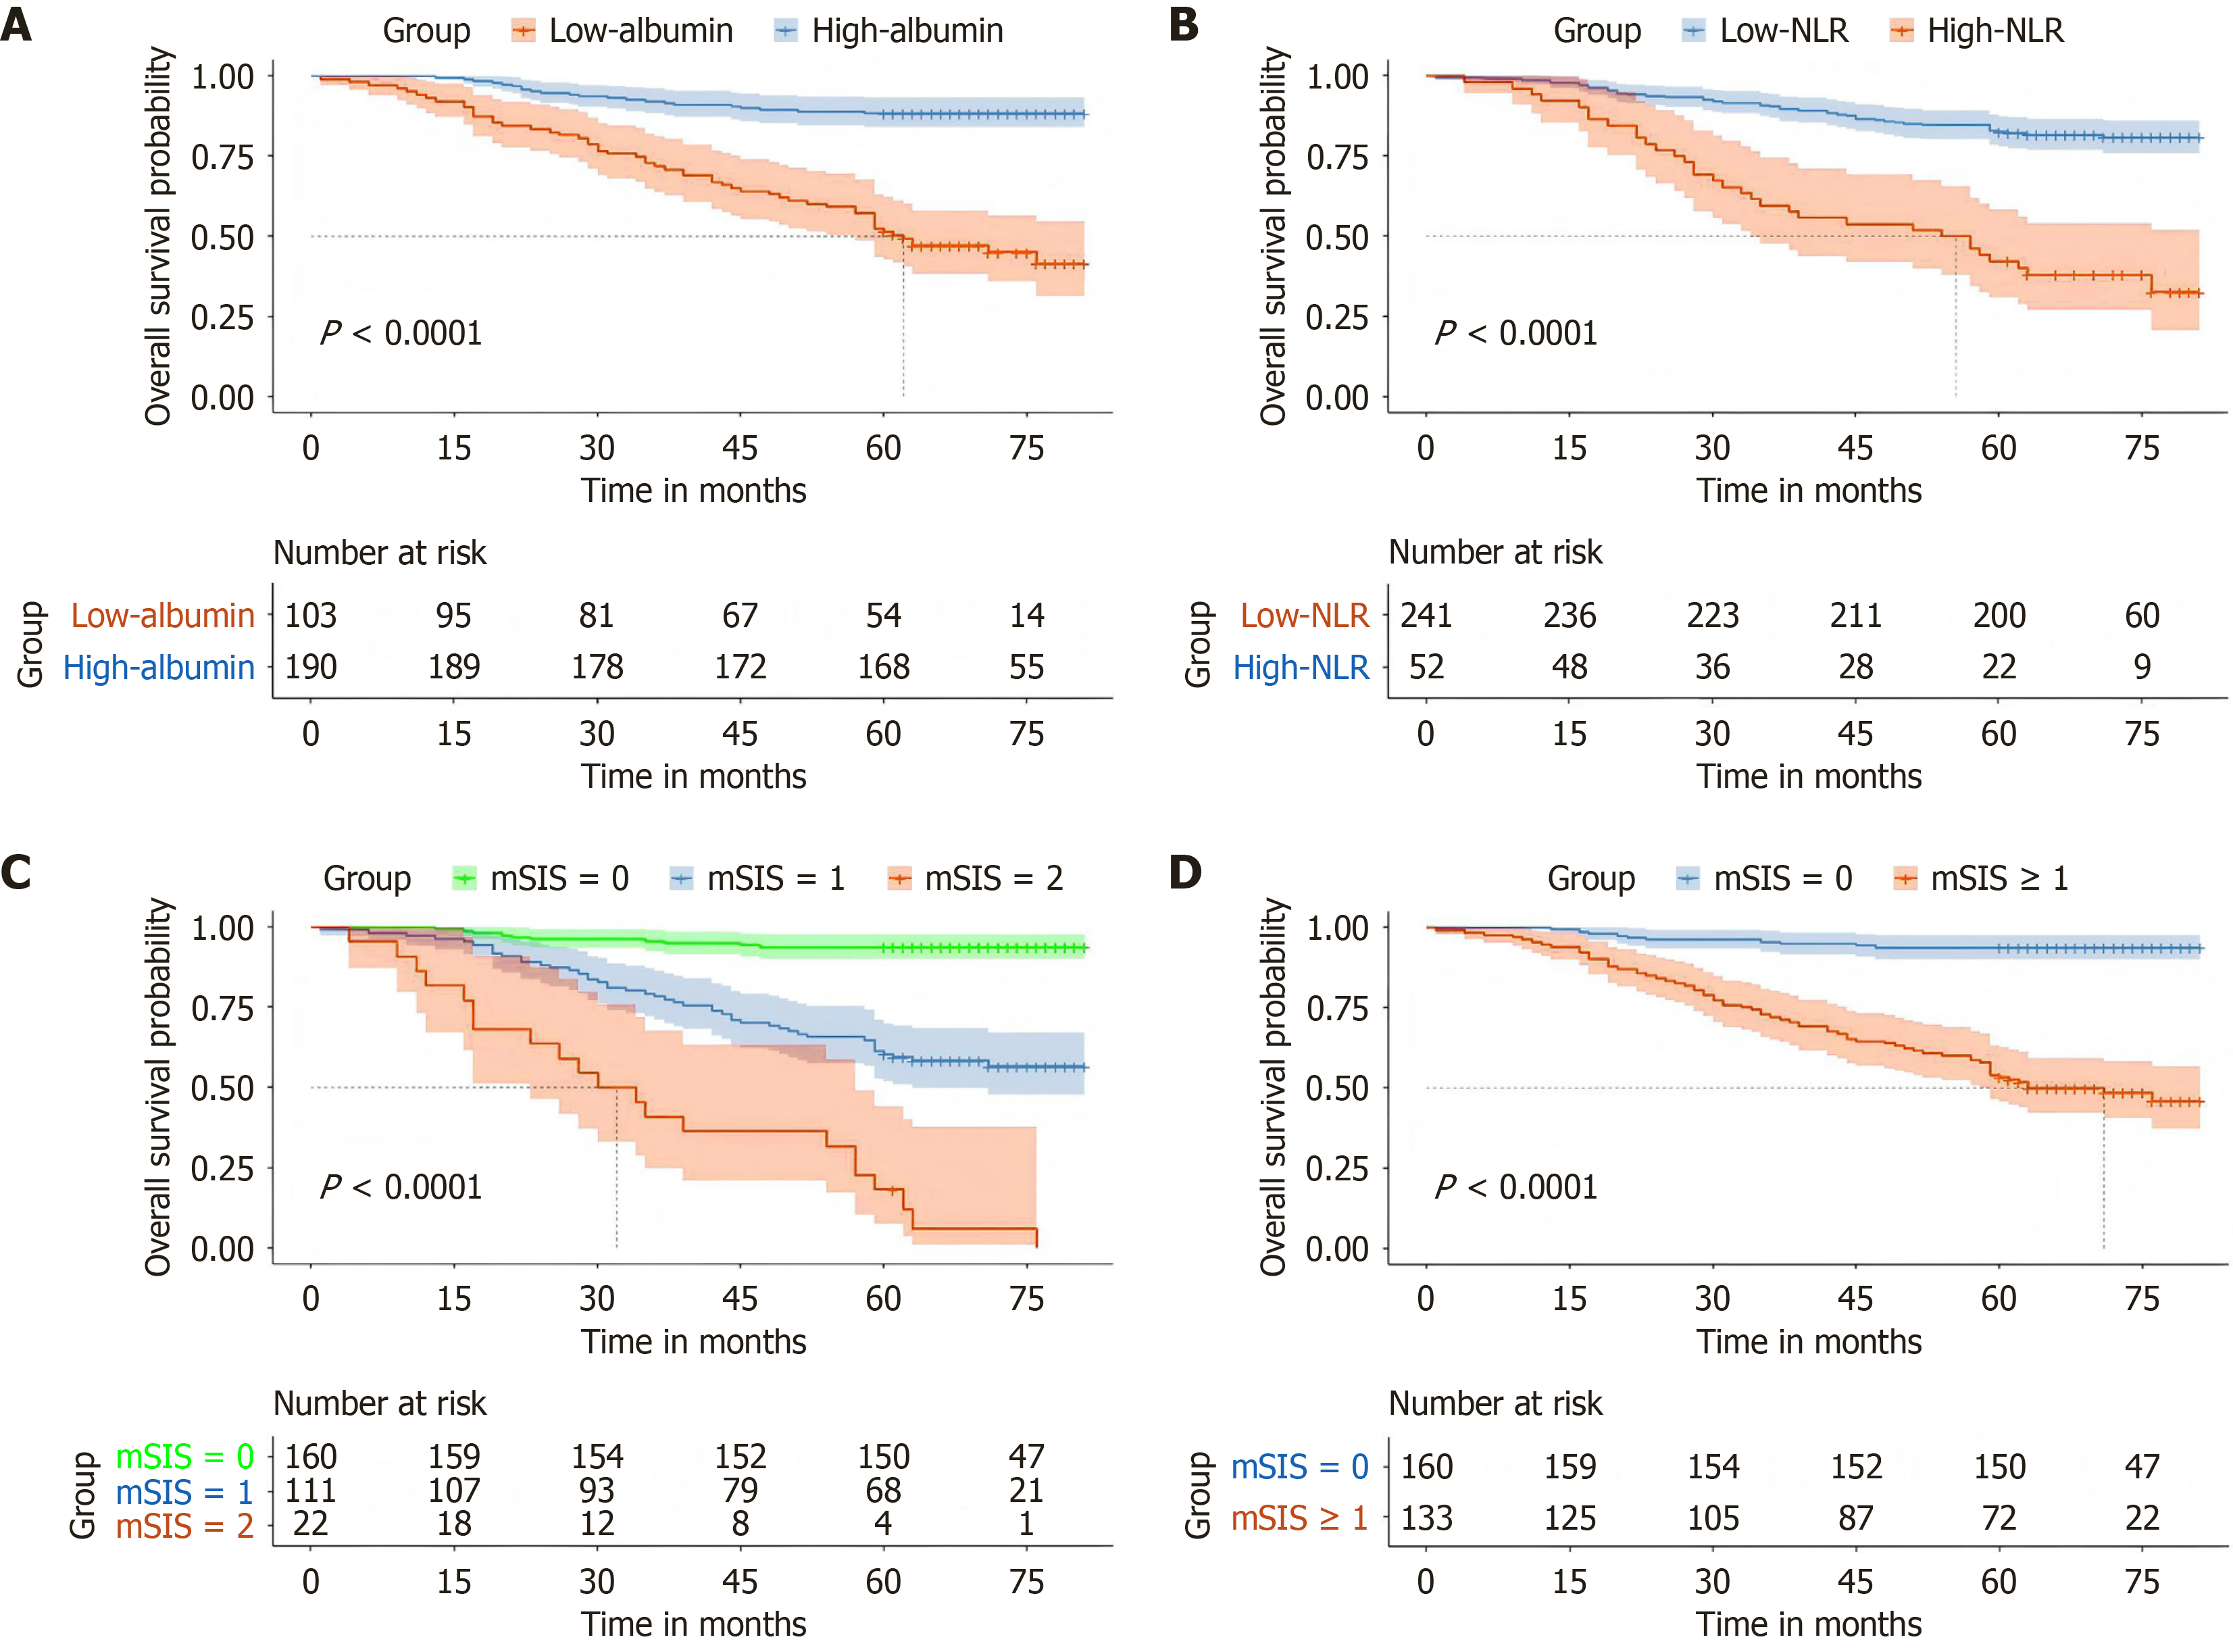
Figure 3 Kaplan-Meier overall survival curves.
A and B: Curves stratified by serum albumin and neutrophil-to-lymphocyte ratio (NLR) in colorectal cancer; A: Overall survival curves for patients in the low-albumin and high-albumin groups; B: Overall survival curves for patients in the low-NLR and high-NLR groups. Shaded areas represent 95% confidence intervals. The numbers of patients at risk at each time point are shown below the plots. P values were calculated using the log-rank test (both P < 0.0001); C and D: Curves stratified by the modified systemic inflammation score; C: Overall survival curves for patients with modified systemic inflammation score (mSIS) scores of 0, 1, and 2; D: Overall survival curves for patients with mSIS = 0 and mSIS ≥ 1. Shaded areas represent 95% confidence interval. The numbers of patients at risk at each time point are shown below the plots. P values were calculated using the log-rank test (both P < 0.0001). mSIS: Modified systemic inflammation score; NLR: Neutrophil-to-lymphocyte ratio.
- Citation: Wang K, Zhang BX, Li KJ, Guan JM, Li BY, Hong ZH, Zeng XY, Zhao ZL, Chen Y. Preoperative immunonutrition status predicts survival after colorectal cancer resection: Nomogram based on modified systemic inflammation score. World J Gastroenterol 2026; 32(30): 119360
- URL: https://www.wjgnet.com/1007-9327/full/v32/i30/119360.htm
- DOI: https://dx.doi.org/10.3748/wjg.119360