
















Copyright: ©Author(s) 2026.
World J Gastroenterol. Aug 14, 2026; 32(30): 119360
Published online Aug 14, 2026. doi: 10.3748/wjg.119360
Published online Aug 14, 2026. doi: 10.3748/wjg.119360
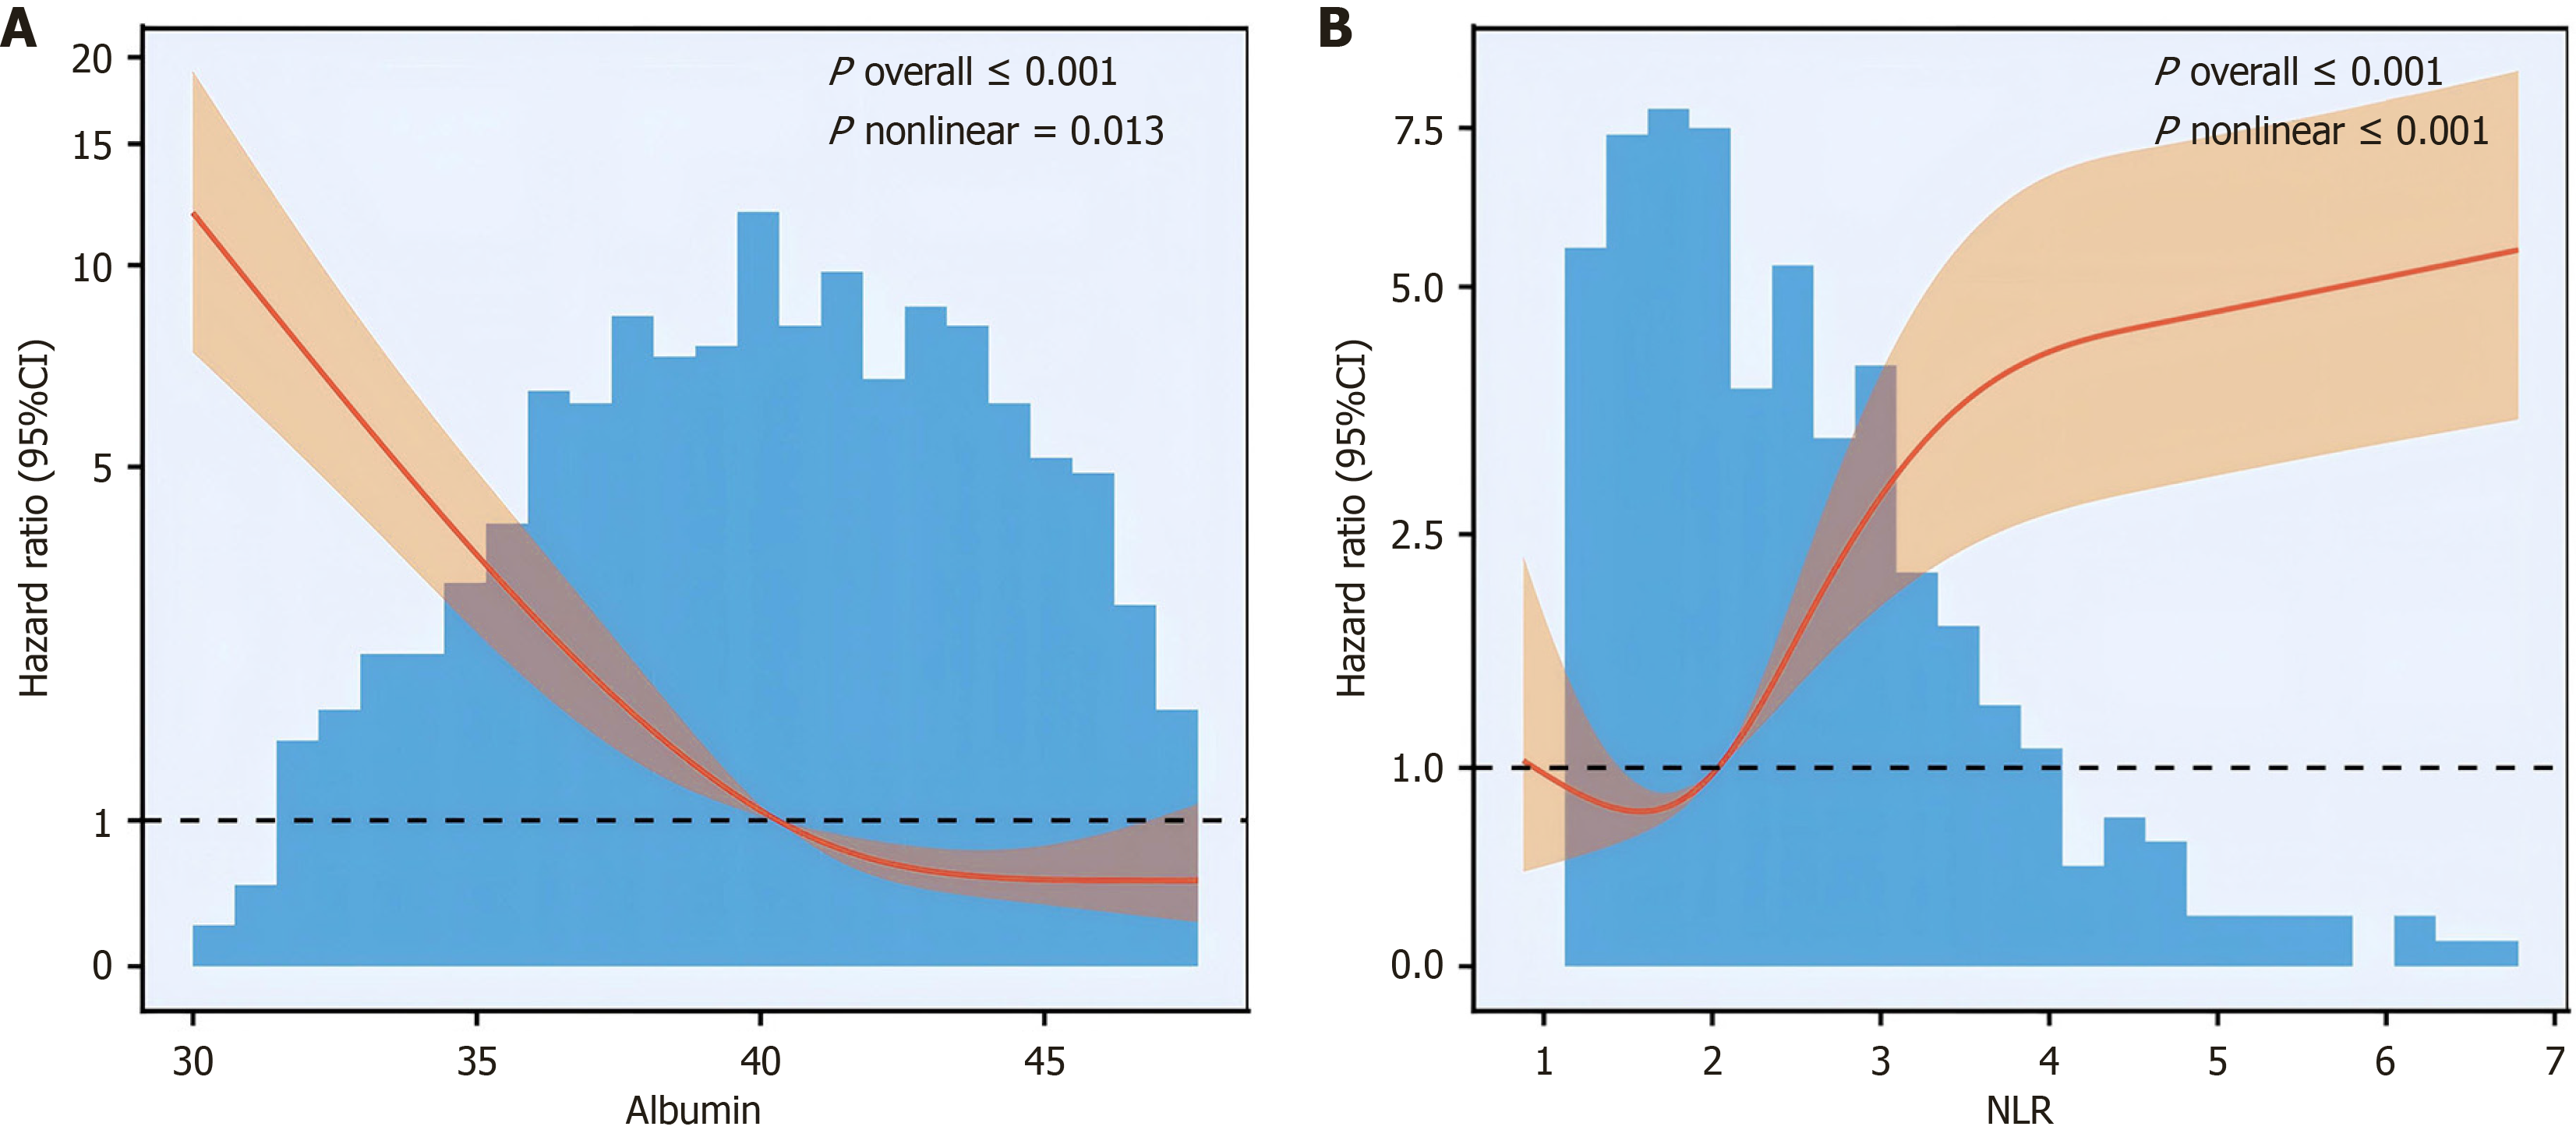
Figure 2 Restricted cubic spline analysis of the associations of serum albumin and neutrophil-to-lymphocyte ratio with the study endpoint.
A: Restricted cubic spline (RCS) curve showing the dose-response relationship between serum albumin level and hazard ratio (HR); B: RCS curve showing the dose-response relationship between neutrophil-to-lymphocyte ratio (NLR) and HR. The solid red line represents the estimated HR, and the shaded area indicates the 95% confidence interval. The black dashed line indicates the reference (HR = 1.0). The distribution of albumin/NLR is shown by the histogram. P values for overall association and nonlinearity are presented in each panel (albumin: P overall < 0.001, P nonlinear = 0.013; NLR: P overall < 0.001, P nonlinear < 0.001). CI: Confidence interval; NLR: Neutrophil-to-lymphocyte ratio.
- Citation: Wang K, Zhang BX, Li KJ, Guan JM, Li BY, Hong ZH, Zeng XY, Zhao ZL, Chen Y. Preoperative immunonutrition status predicts survival after colorectal cancer resection: Nomogram based on modified systemic inflammation score. World J Gastroenterol 2026; 32(30): 119360
- URL: https://www.wjgnet.com/1007-9327/full/v32/i30/119360.htm
- DOI: https://dx.doi.org/10.3748/wjg.119360