
















Copyright: ©Author(s) 2026.
World J Gastroenterol. Aug 14, 2026; 32(30): 118301
Published online Aug 14, 2026. doi: 10.3748/wjg.118301
Published online Aug 14, 2026. doi: 10.3748/wjg.118301
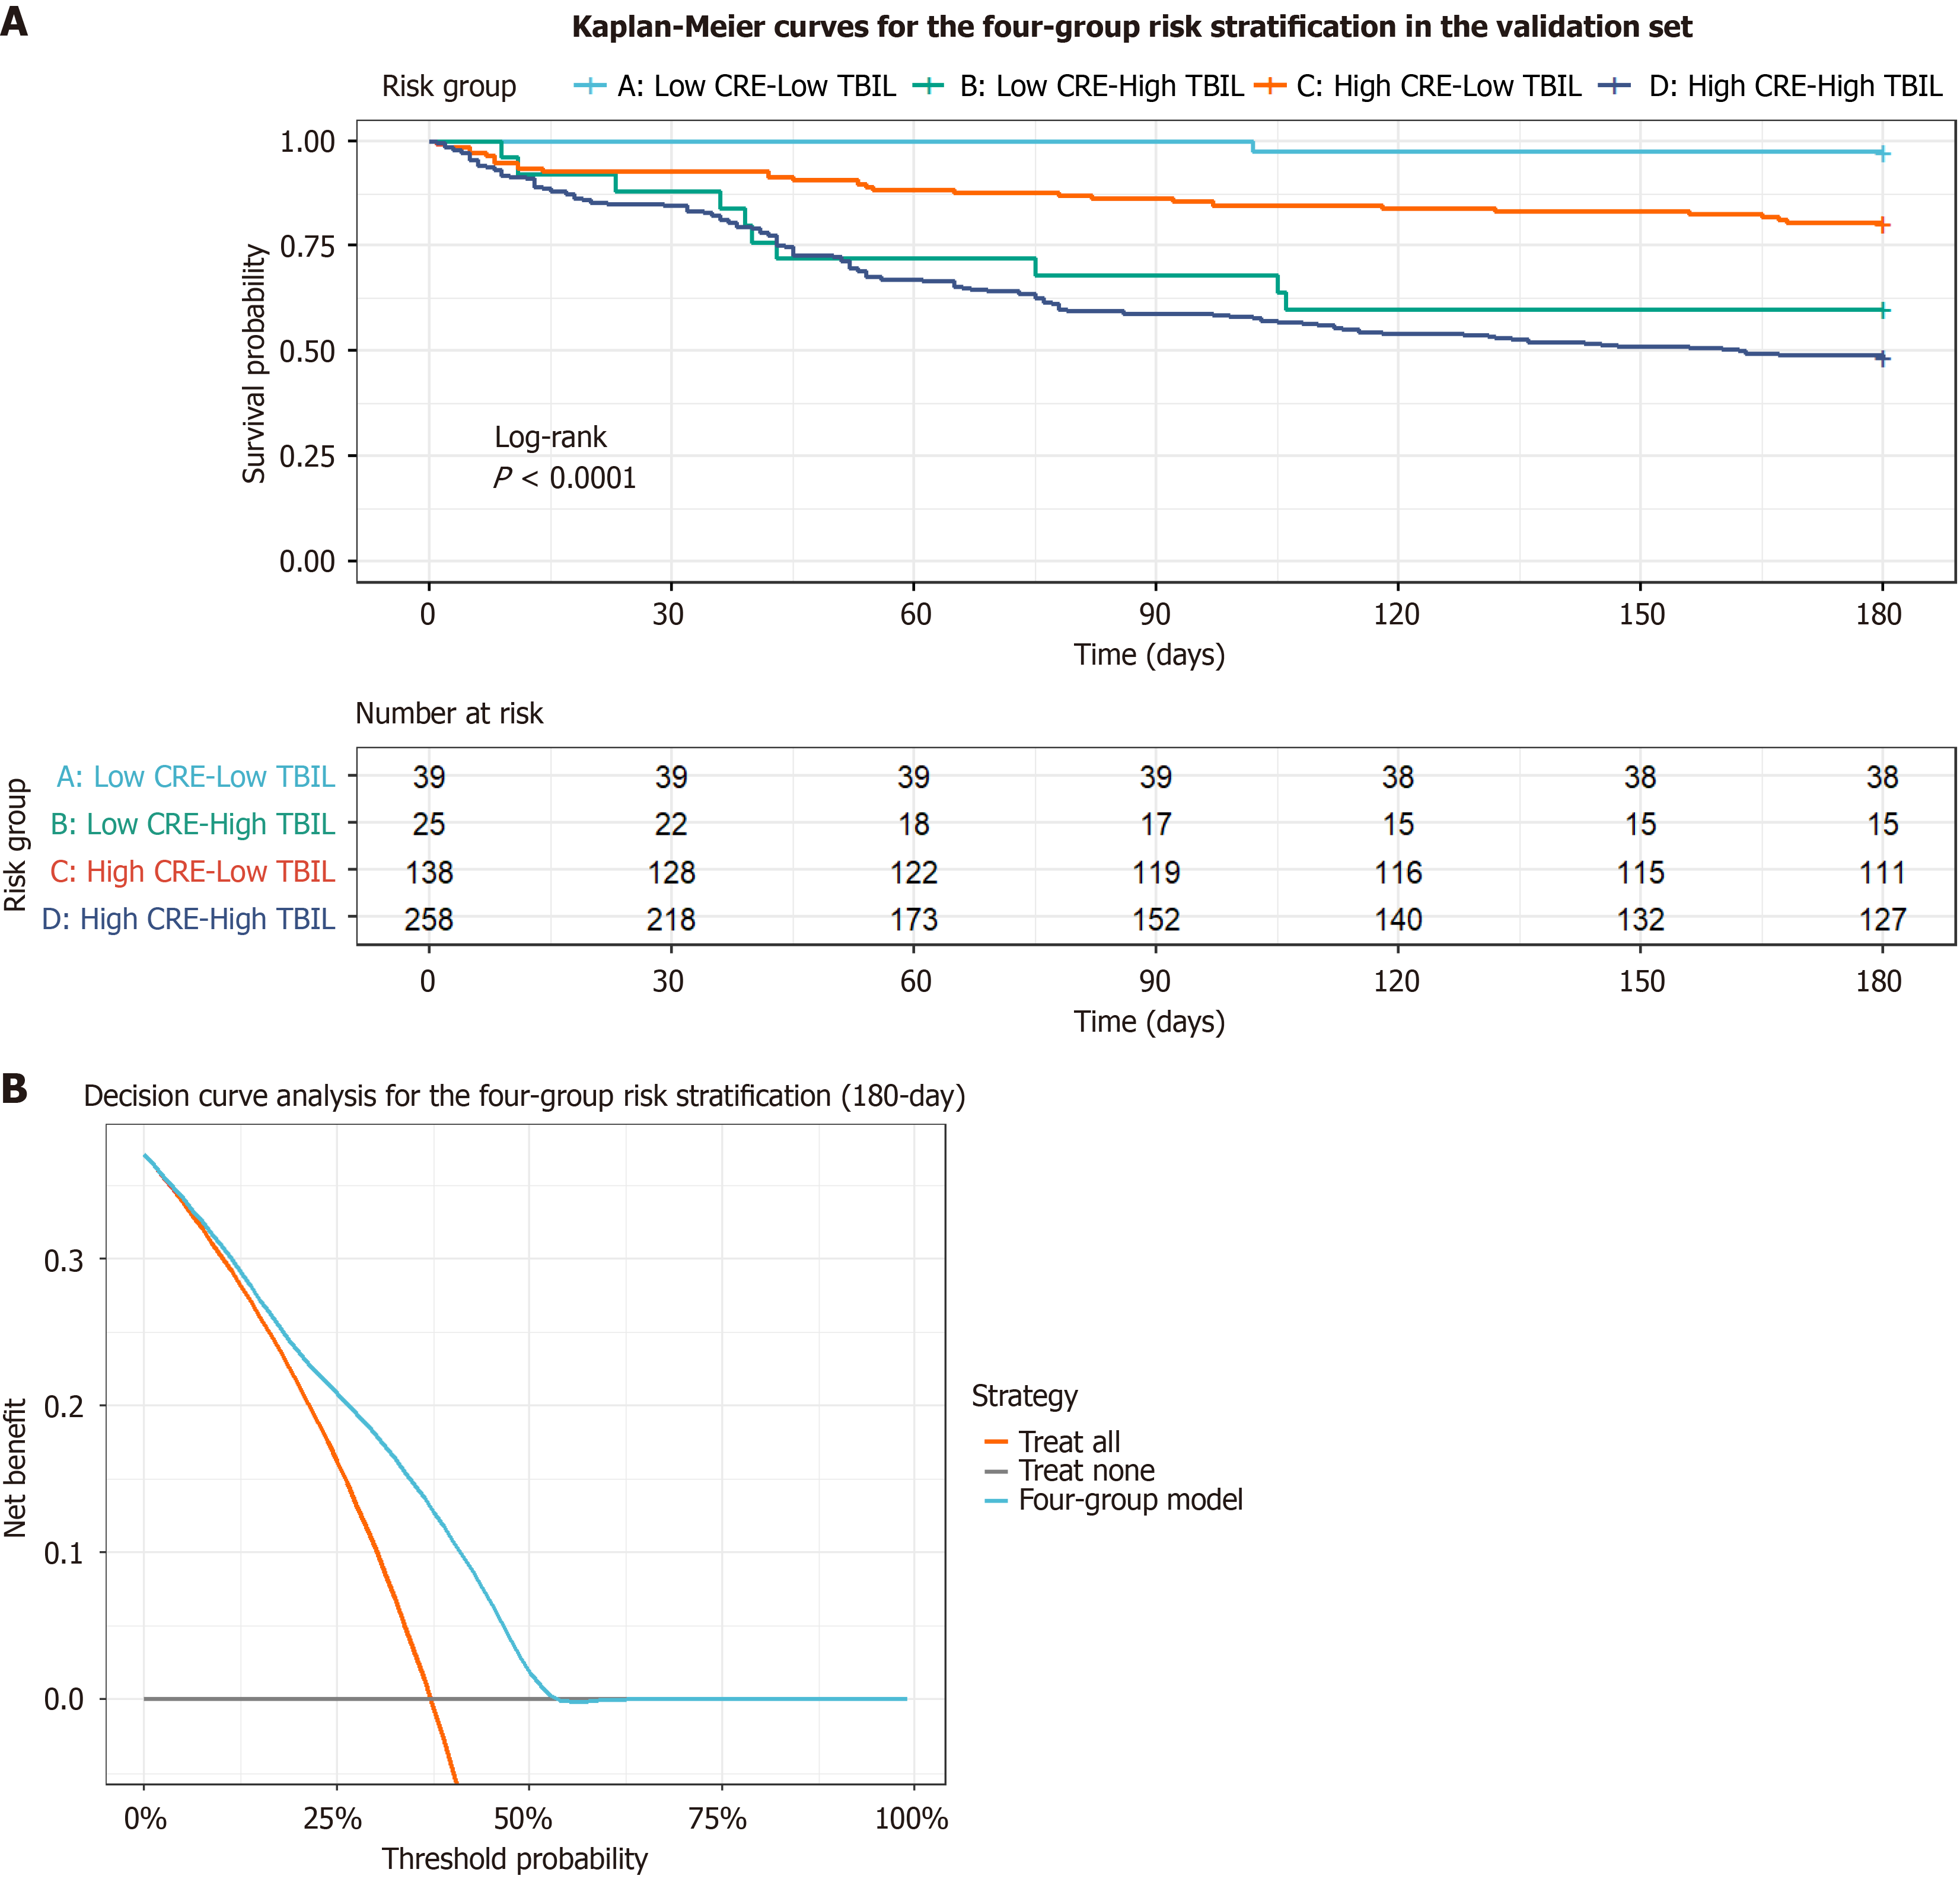
Figure 5 Validation of the four-group risk stratification.
A: Kaplan-Meier survival curves for the four distinct risk groups. The P value was calculated using the log-rank test; B: Decision curve analysis demonstrating the clinical net benefit of the four-group stratification model across a range of threshold probabilities. CRE: Creatinine; TBIL: Total bilirubin.
- Citation: Xv YW, Ling J, Hao XG, Xu TJ, Tian H, Lv S, You SL, Zhu B. Risk-stratified assessment of 180-day mortality in severe alcoholic hepatitis. World J Gastroenterol 2026; 32(30): 118301
- URL: https://www.wjgnet.com/1007-9327/full/v32/i30/118301.htm
- DOI: https://dx.doi.org/10.3748/wjg.118301