
















Copyright: ©Author(s) 2026.
World J Gastroenterol. Aug 14, 2026; 32(30): 118301
Published online Aug 14, 2026. doi: 10.3748/wjg.118301
Published online Aug 14, 2026. doi: 10.3748/wjg.118301
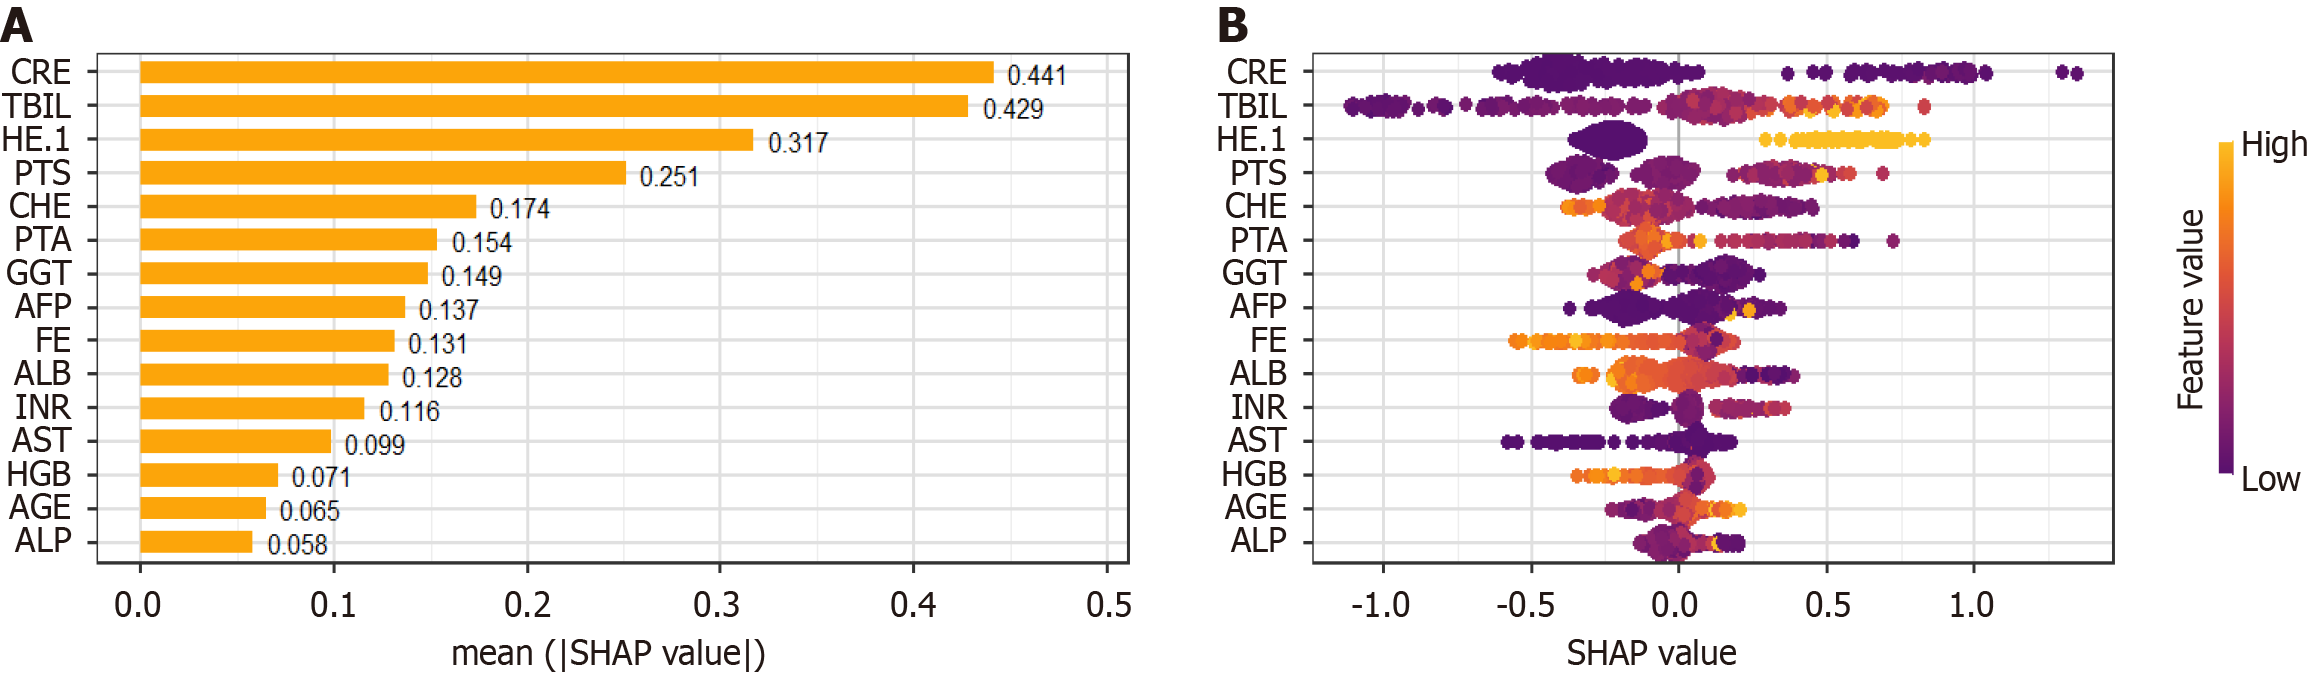
Figure 3 Interpretation of the XGBoost model using Shapley Additive exPlanations analysis on the training set.
A: Shapley Additive exPlanations (SHAP) summary plot illustrating the global importance and impact of the top 20 predictors. Each point represents a patient for a given feature, with the color indicating the feature's value (red for high, blue for low); B: SHAP beeswarm plot providing a detailed distribution of each feature's impact on the model output. CRE: Creatinine; TBIL: Total bilirubin; HE: Hepatic encephalopathy; PTS: Prothrombin time seconds; CHE: Cholinesterase; PTA: Prothrombin activity; GGT: Gamma-glutamyl transferase; AFP: Alpha-fetoprotein; FE: Iron; ALB: Albumin; INR: International normalized ratio; AST: Aspartate aminotransferase; HGB: Hemoglobin; ALP: Alkaline phosphatase; SHAP: Shapley Additive exPlanations.
- Citation: Xv YW, Ling J, Hao XG, Xu TJ, Tian H, Lv S, You SL, Zhu B. Risk-stratified assessment of 180-day mortality in severe alcoholic hepatitis. World J Gastroenterol 2026; 32(30): 118301
- URL: https://www.wjgnet.com/1007-9327/full/v32/i30/118301.htm
- DOI: https://dx.doi.org/10.3748/wjg.118301