
















Copyright: ©Author(s) 2026.
World J Gastroenterol. Aug 14, 2026; 32(30): 118301
Published online Aug 14, 2026. doi: 10.3748/wjg.118301
Published online Aug 14, 2026. doi: 10.3748/wjg.118301
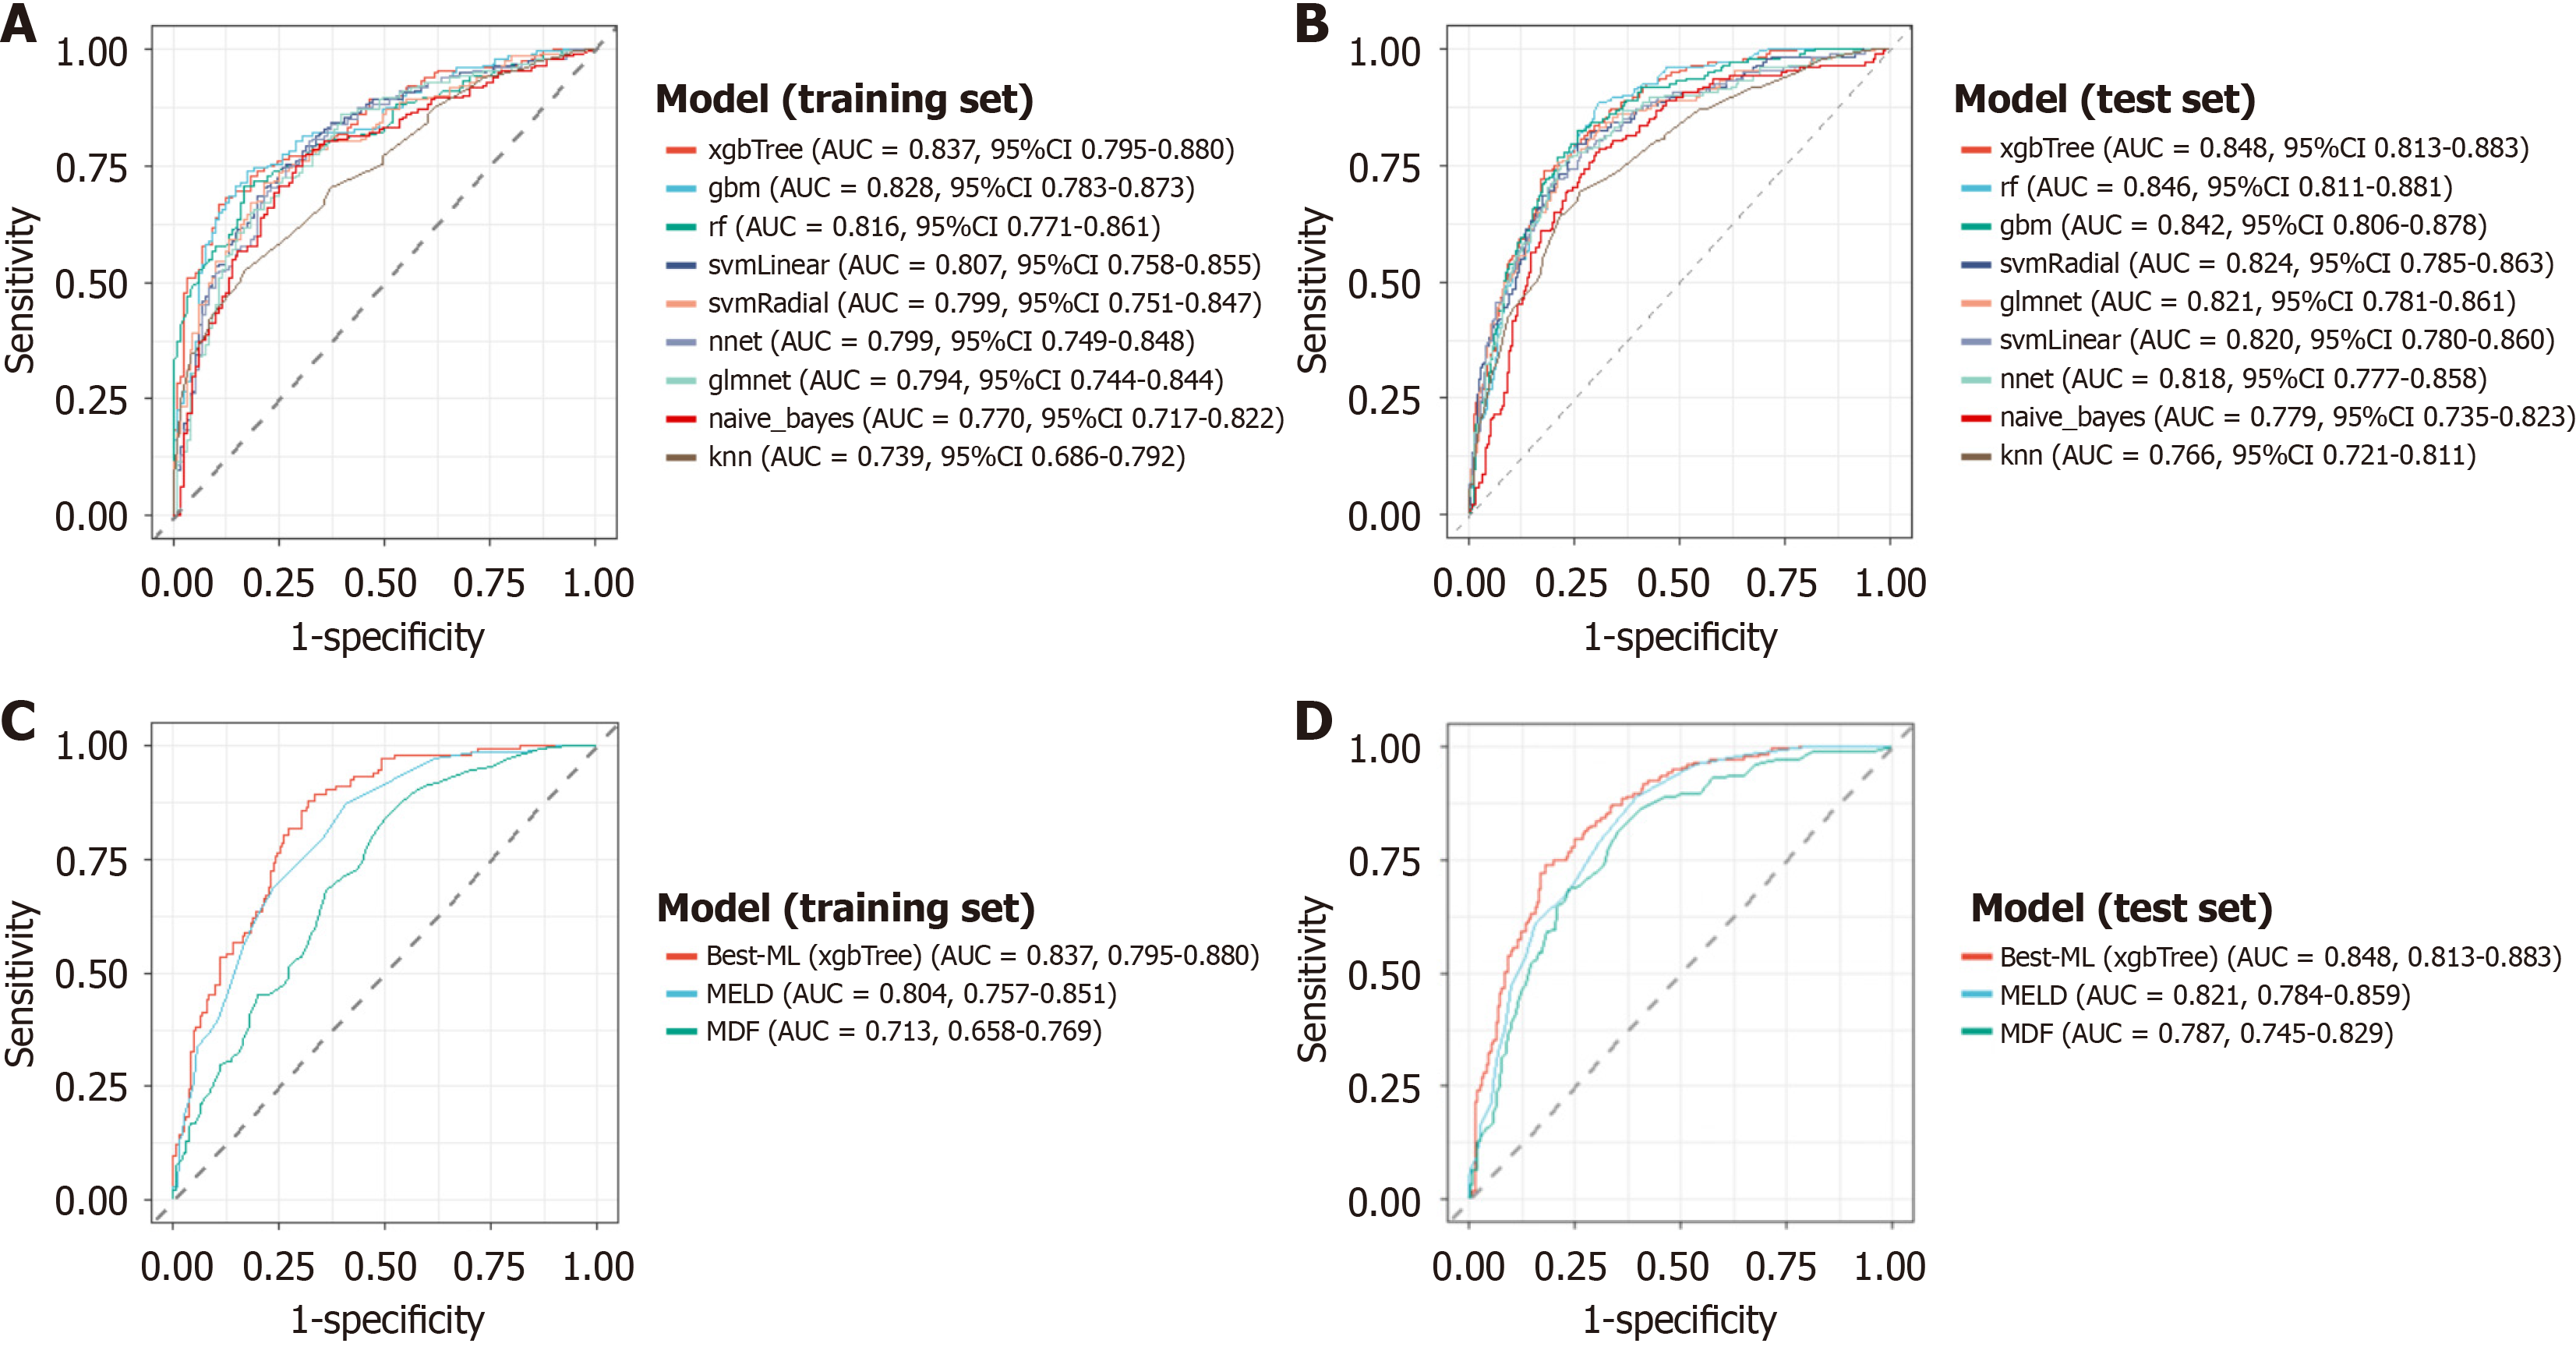
Figure 2 Machine learning model performance and comparison.
A: Receiver operating characteristic (ROC) curves of nine machine learning models in the training set (internal validation); B: ROC curves of the nine models in the independent test set; C: ROC curve comparison between the best-performing model (XGBoost) and traditional scores (model for end-stage liver disease and Maddrey discriminant function) in the training set; D: ROC curve comparison between the XGBoost model and traditional scores in the independent test set. AUC: Area under the curve; ML: Machine learning; MELD: Model for end-stage liver disease; MDF: Maddrey discriminant function.
- Citation: Xv YW, Ling J, Hao XG, Xu TJ, Tian H, Lv S, You SL, Zhu B. Risk-stratified assessment of 180-day mortality in severe alcoholic hepatitis. World J Gastroenterol 2026; 32(30): 118301
- URL: https://www.wjgnet.com/1007-9327/full/v32/i30/118301.htm
- DOI: https://dx.doi.org/10.3748/wjg.118301