
















©The Author(s) 2026.
World J Gastroenterol. Jan 21, 2026; 32(3): 115264
Published online Jan 21, 2026. doi: 10.3748/wjg.v32.i3.115264
Published online Jan 21, 2026. doi: 10.3748/wjg.v32.i3.115264
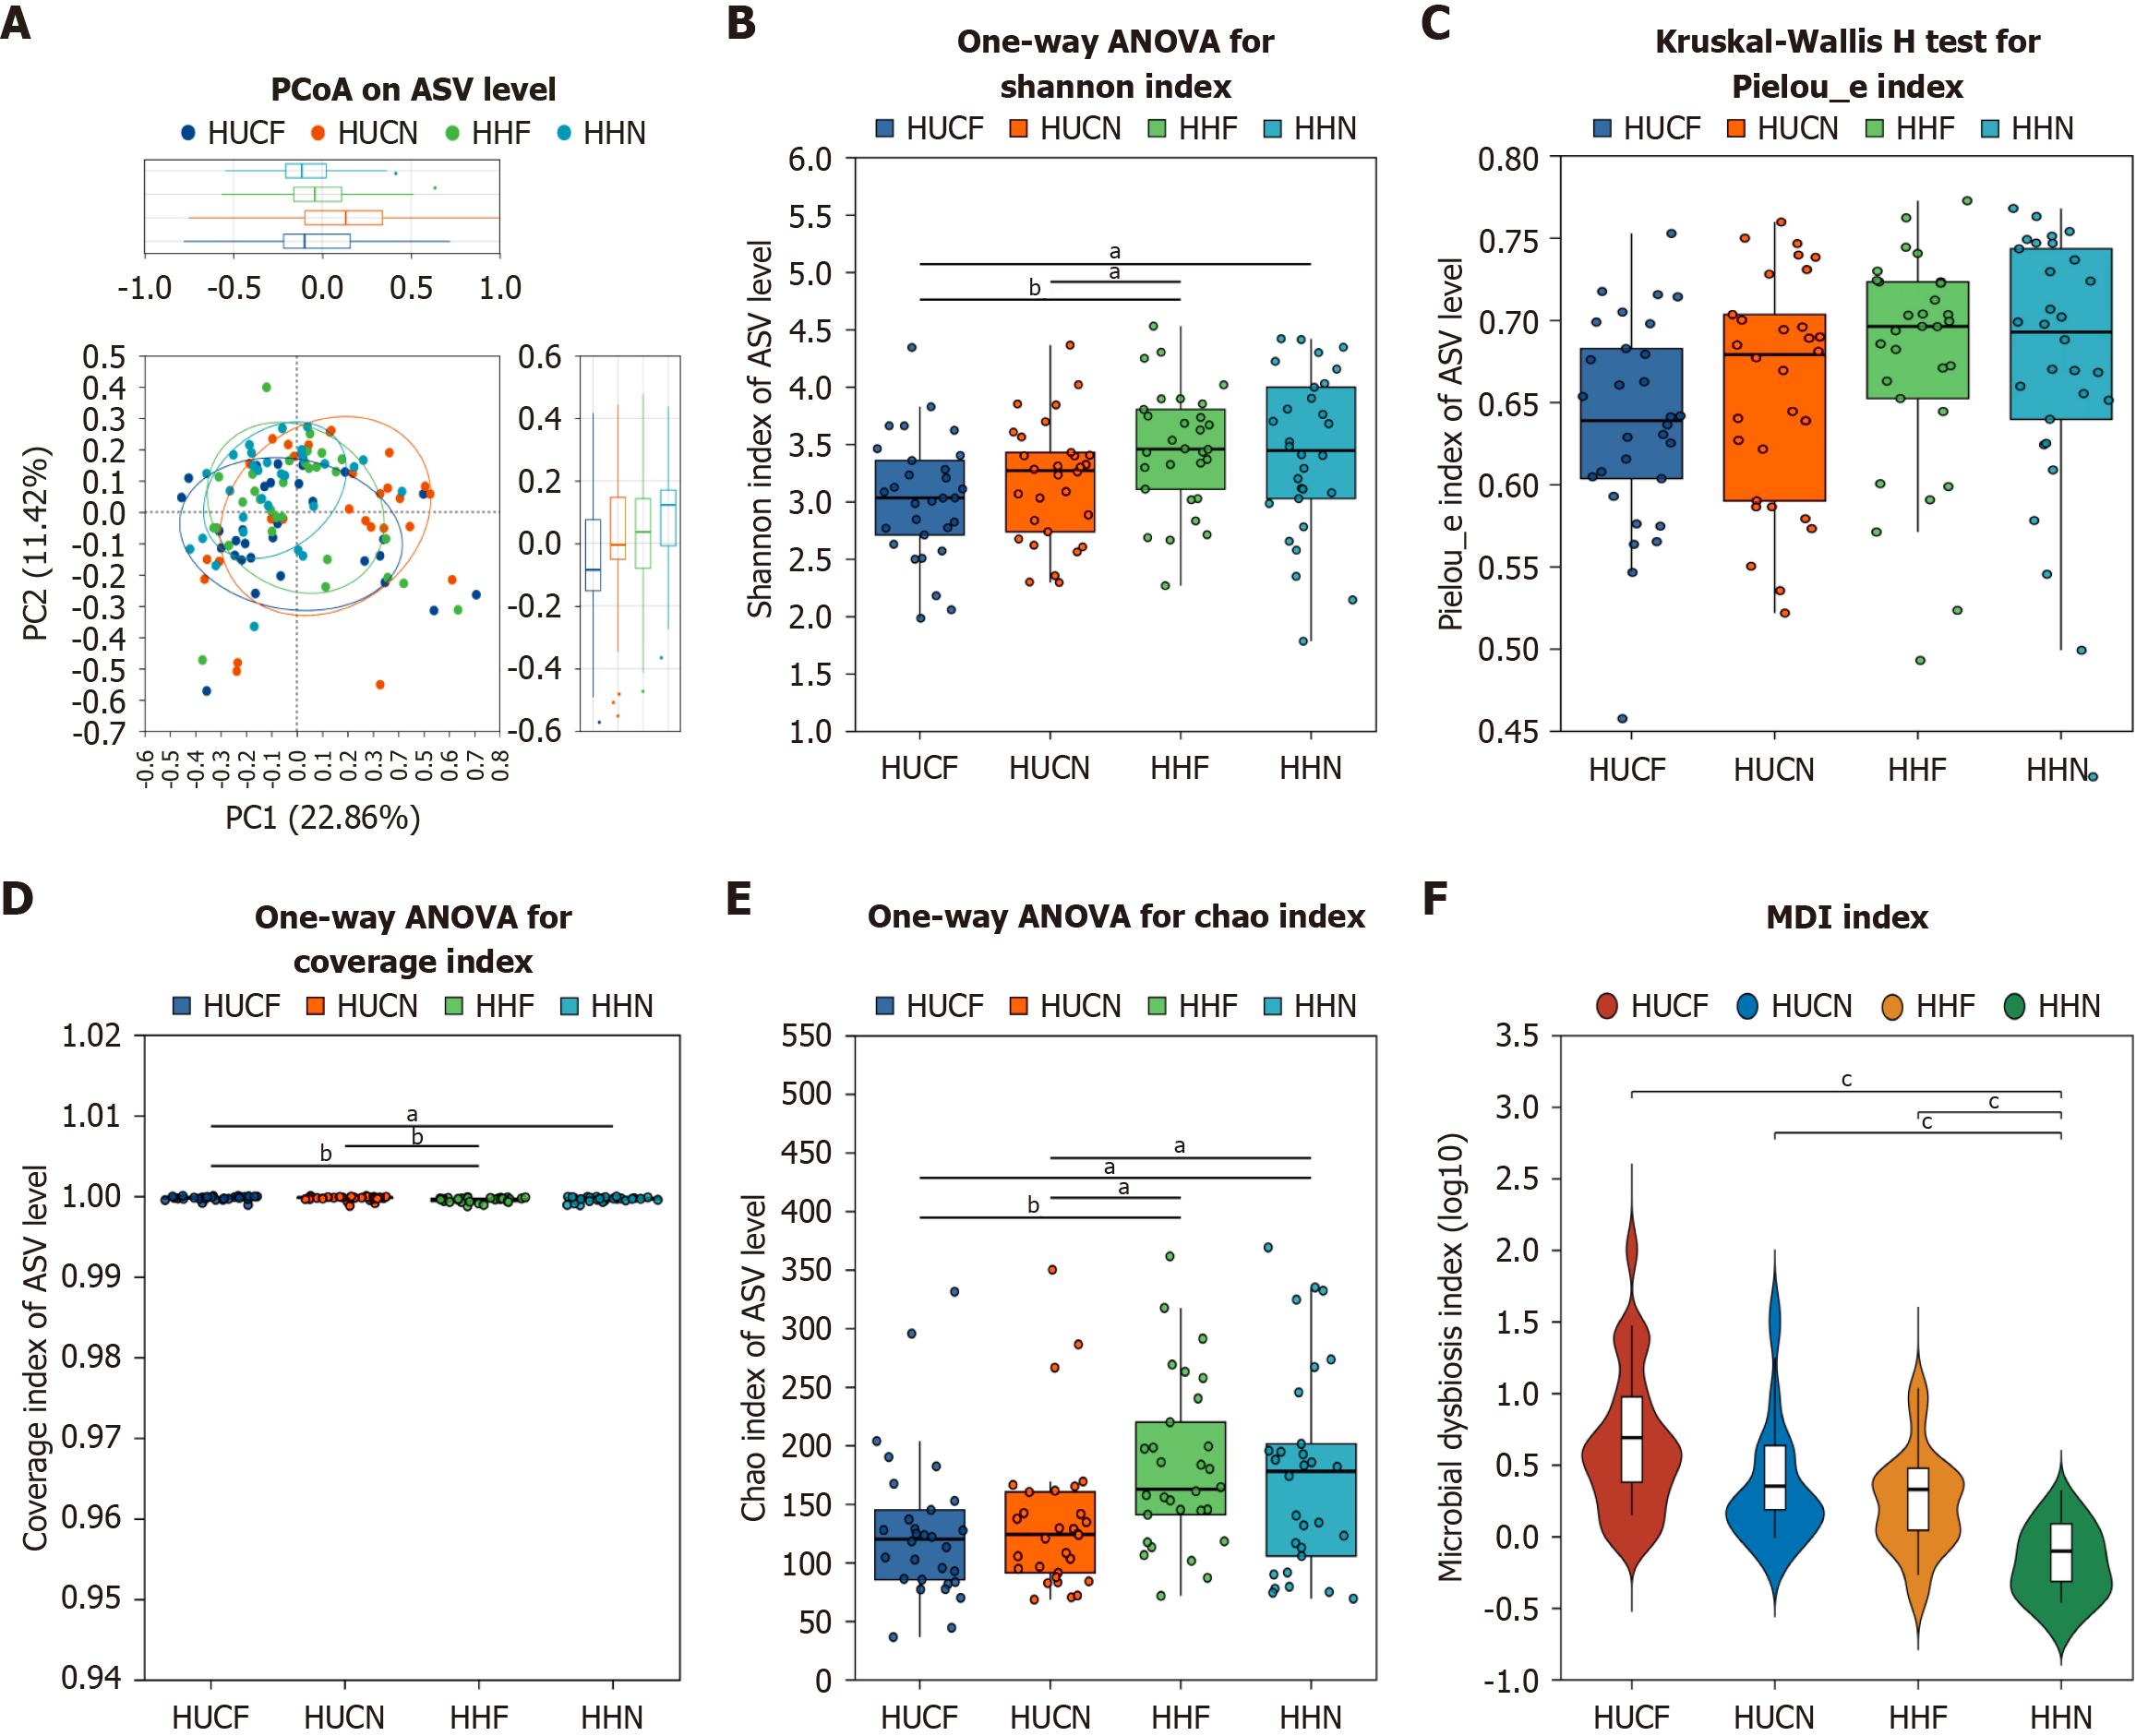
Figure 6 Microbial diversity analysis.
A: Principal coordinate analysis plot; B-E: Box plot of alpha diversity indices across groups; F: Group comparison of dysbiosis index. 0.01 < aP ≤ 0.05; 0.001 < bP ≤ 0.01; cP ≤ 0.001. PCoA: Principal component analysis; ASV: Amplicon sequence variant; HHF: Healthy with fatigue; HHN: Healthy without fatigue; HUCF: Ulcerative colitis with fatigue; HUCN: Ulcerative colitis without fatigue.
- Citation: Liu ZX, Liu XY, Tan WW, Zhang WB, Zhang YL, Zheng L, Dai YC. Characteristics of gut microbiota and metabolites in patients with ulcerative colitis with fatigue. World J Gastroenterol 2026; 32(3): 115264
- URL: https://www.wjgnet.com/1007-9327/full/v32/i3/115264.htm
- DOI: https://dx.doi.org/10.3748/wjg.v32.i3.115264