
















Copyright: ©Author(s) 2026.
World J Gastroenterol. Jul 28, 2026; 32(28): 119442
Published online Jul 28, 2026. doi: 10.3748/wjg.119442
Published online Jul 28, 2026. doi: 10.3748/wjg.119442
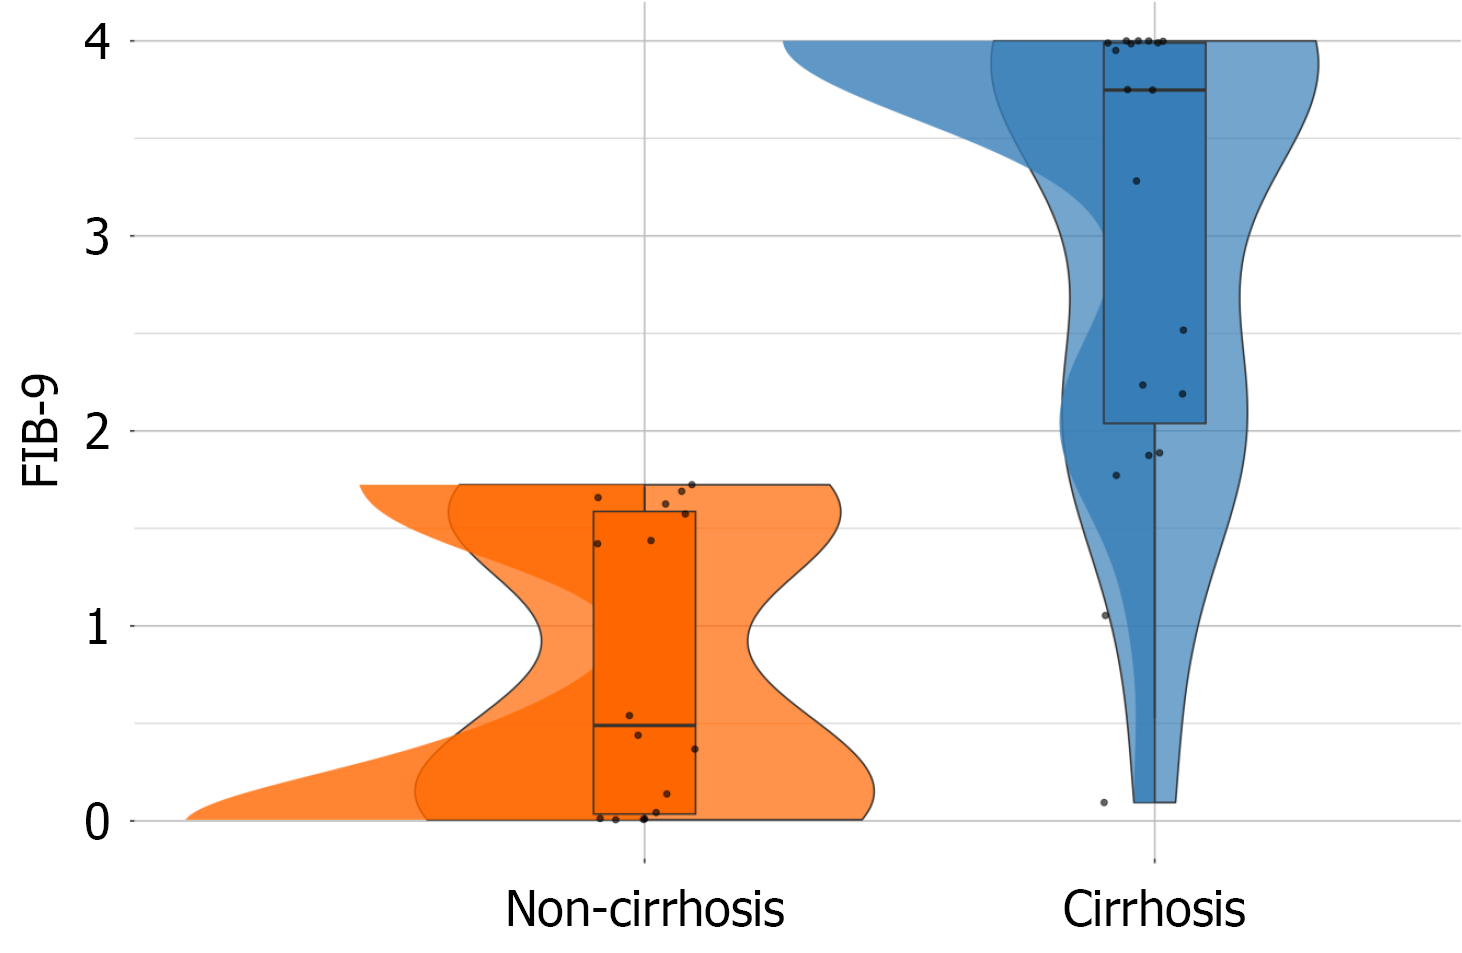
Figure 3 Distribution of fibrosis-9 scores in patients with hypopituitarism, stratified by cirrhosis status.
Raincloud plots depict the distribution of fibrosis-9 values for patients with (n = 19; blue) and without cirrhosis (n = 16; orange). The width of the violins indicates data density at each value, while boxplots show median (central line), interquartile range (box boundaries), and range (whiskers). FIB-9: Fibrosis-9.
- Citation: Li T, Wang X, Nie M, Han Q, Wu XY, Mao JF. Fibrosis index nine superiority for cirrhosis in hypopituitarism: Clinical validation of endocrine liver triage tool. World J Gastroenterol 2026; 32(28): 119442
- URL: https://www.wjgnet.com/1007-9327/full/v32/i28/119442.htm
- DOI: https://dx.doi.org/10.3748/wjg.119442